Find Patient Churn Rate (PLV part 4)
Patient churn rate is the most difficult metric of patient lifetime value to calculate. Before calculating it, be sure that you have found your max patient recall time and rate.
Jump to another section in this series: Finding Patient Lifetime Value
What is patient churn rate and patient lifespan?
Patient lifespan is the number of time periods (e.g. years) a patient sees you, on average.
Patient churn rate is the percentage of patients that leave your practice within this time period.

Patient lifespan is the inverse of churn rate.
Many retailers might use one year for determining churn. For many providers, this is not appropriate.
Patients see opthamologists every 2-5 years. Clients and recipients see counselors every few weeks. If
you use one year as a basis for churn your estimates and marketing budget would be inaccurate.
It is crucial to find patient recall time before lifespan and churn rate. Your max patient recall time lets you know when a patient should be considered lost. If you have enough of it, your own data is the best tool for making these assumptions.
Count return patients
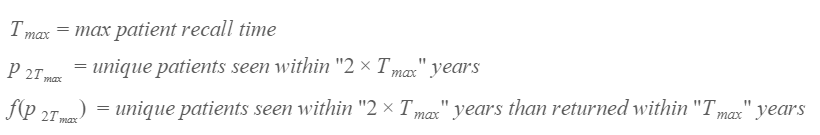
Now that you have your max patient recall time Tmax you need to use it.
First, you will find total patients seen over twice this time span. Then, you will find those that returned within a single span.
It is easier to use Excel or Google Sheets in conjunction with EHR data for the following steps. That said, you can also count them manually.
While you do not need to calculate Tmax every year, you should count your total and returned patients every year.
Patients within twice your max Patient Recall Time
Without Excel
Using your EHR, pull a report of all patients seen within 2*Tmax years from December 31 of last year. For example, if your max patient recall time is 2.2 years, you want 4.4 years of appointments.
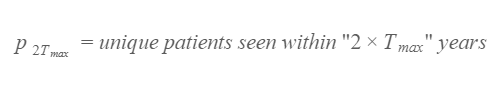
Count the total. We will represent it as p2Tmax.
This figure will be less than your total appointments. Some patients will have seen you two or more times.
Having trouble finding a report in your EHR that shows you unique patients? The meddkit team can do it for you. Or, you can export the data yourself and open it with Excel.

With Excel
First, open your extract of patient names and encounter dates. You exported this data when you were finding your patient recall time.
Find an empty space in the file and enter the formula below. It assumes that your patient identifiers are in column “B”. Change the references if they are not.
=COUNTUNIQUE(B2:B)
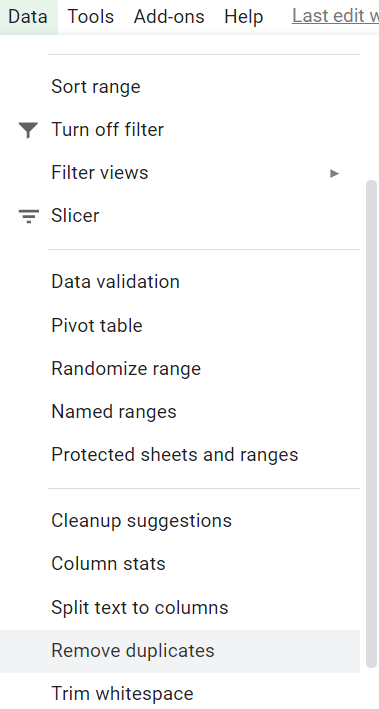
You can also find this number by removing duplicates.
Select column “B”, or whatever column contains your patient identifiers. Select “Remove Duplicates” in Excel or Google Sheets.
Select the entire column that you just removed duplicates from. At the bottom right of the sheet, you will find “Count: ###”.

Just make sure to undo the “Remove Duplicates” once complete. We’ll be using this data later
Save this total count. It is the patients you saw within your max patient recall time.
Find the subset of patients who returned
Without Excel
Save your previous EHR report. Copy it and modify the criteria to show only patients seen within Tmax years.
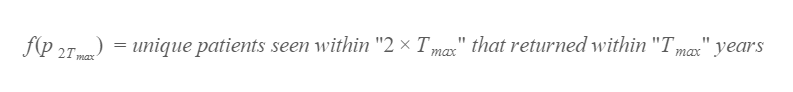
Now, “circle” all of the patients on this report who also appear on the prior report. Count the circles and you have. The number of circles represents f(p2Tmax). We will use this number later.
The meddkit team can automate this task for you, too.
With Excel
Head back to your export of patient encounter data.
Filter this sheet to show only Tmax years from December 31 of last year.
For example, if your average appointment frequency is 2.2 years, you will now see 4.4 years of appointments. Use a filter on this sheet to hide all but the last 2.2 years of appointments.
You can use Excel or Google Sheets’ filter on the Date column to filter out the old dates. Enter your lookback date into a “Filter by condition”.

Confirm that you have filtered out the older dates. Now, copy this sheet to a new sheet in the same Excel or Google Sheets document.
Insert a new column into this sheet called “Repeat patient?”. Enter an IF formula into the first cell of this column to count
=IFERROR(IF(MATCH(‘Sheet2’!$B2,’Sheet1’!B:B,0),1),0)
This formula looks for all patients on the first sheet. It returns a “1” if it finds a match and a “0” if it does not.
Once again, we are assuming that your patient identifiers are in column “B”. Change the references if they are not.
Finally, select the entire “Repeat patient?” column. Find the “Sum” in the bottom right of the screen.

This sum will be used later and is:
Calculate Patient Churn Rate and Patient Lifespan
There is a lot of misinformation online about patient churn rate and patient lifespan.
Explanations are either vague or full of faulty assumptions.
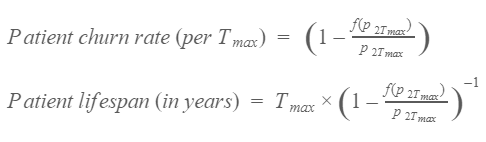
Patient Churn Rate and Patient Lifespan Formulas
Now, substitute the numbers you just found into these formulas.
To calculate patient churn rate and patient lifespan, you need to have done the prework. You should have found your patient recall time, the total number of unique patients seen within twice this timeframe, and the subset of those that returned.
Once you have confirmed these values, you can calculate your patient churn rate and patient lifespan.
The first formula represents the patient churn rate.
The second formula is your patient lifespan. It is the inverse of the first formula, times your appointment frequency.
These calculations can get tricky. Again, contact meddkit if you need help.

Once you have your patient churn rate and patient lifespan, save them. They will be useful for years to come.
You can now use patient lifespan, along with gross profit per appointment and patient recall rate, to find patient lifetime value.
The final step is to calculate patient lifetime value.