Quick answers
Bottom line. Cash pay is growing as an add-on to insurance and in specific fields (chiropractic, therapy, optometry, mental health, direct primary care and concierge), not across medicine as a whole. Patients pay more dollars out of pocket, but a smaller share of the total bill. Those patients tend to cut back on care rather than shop around, so for practices the lever is a specific price before the visit and easy access.
Are more practices going cash-only?
Direct primary care (DPC) grew from about 125 practices in 2014 to 3,238 in October 2026 [1,2]. Concierge plus DPC sites rose from about 0.8% to about 1.5% of physician offices between 2018 and 2023 Modeled [3,4,5].
Has medicine as a whole shifted toward cash pay?
The patient-paid share of physician-office revenue fell from 10.3% in 2006 to 7.2% in 2023 [6,7].
Where is cash pay actually growing?
Patient-paid share of revenue rose from 2015 to 2022 for chiropractors (32.6% to 41.0%), therapists and counselors (19.4% to 24.2%) and optometrists (41.0% to 44.8%) [8,7]. About 35% of psychotherapists and 41–45% of psychiatrists don't take insurance [9,10,11]. Cosmetic care and LASIK are largely cash, and IVF and GLP-1 care often are [12,13,14,15].
Are patients paying more out of pocket?
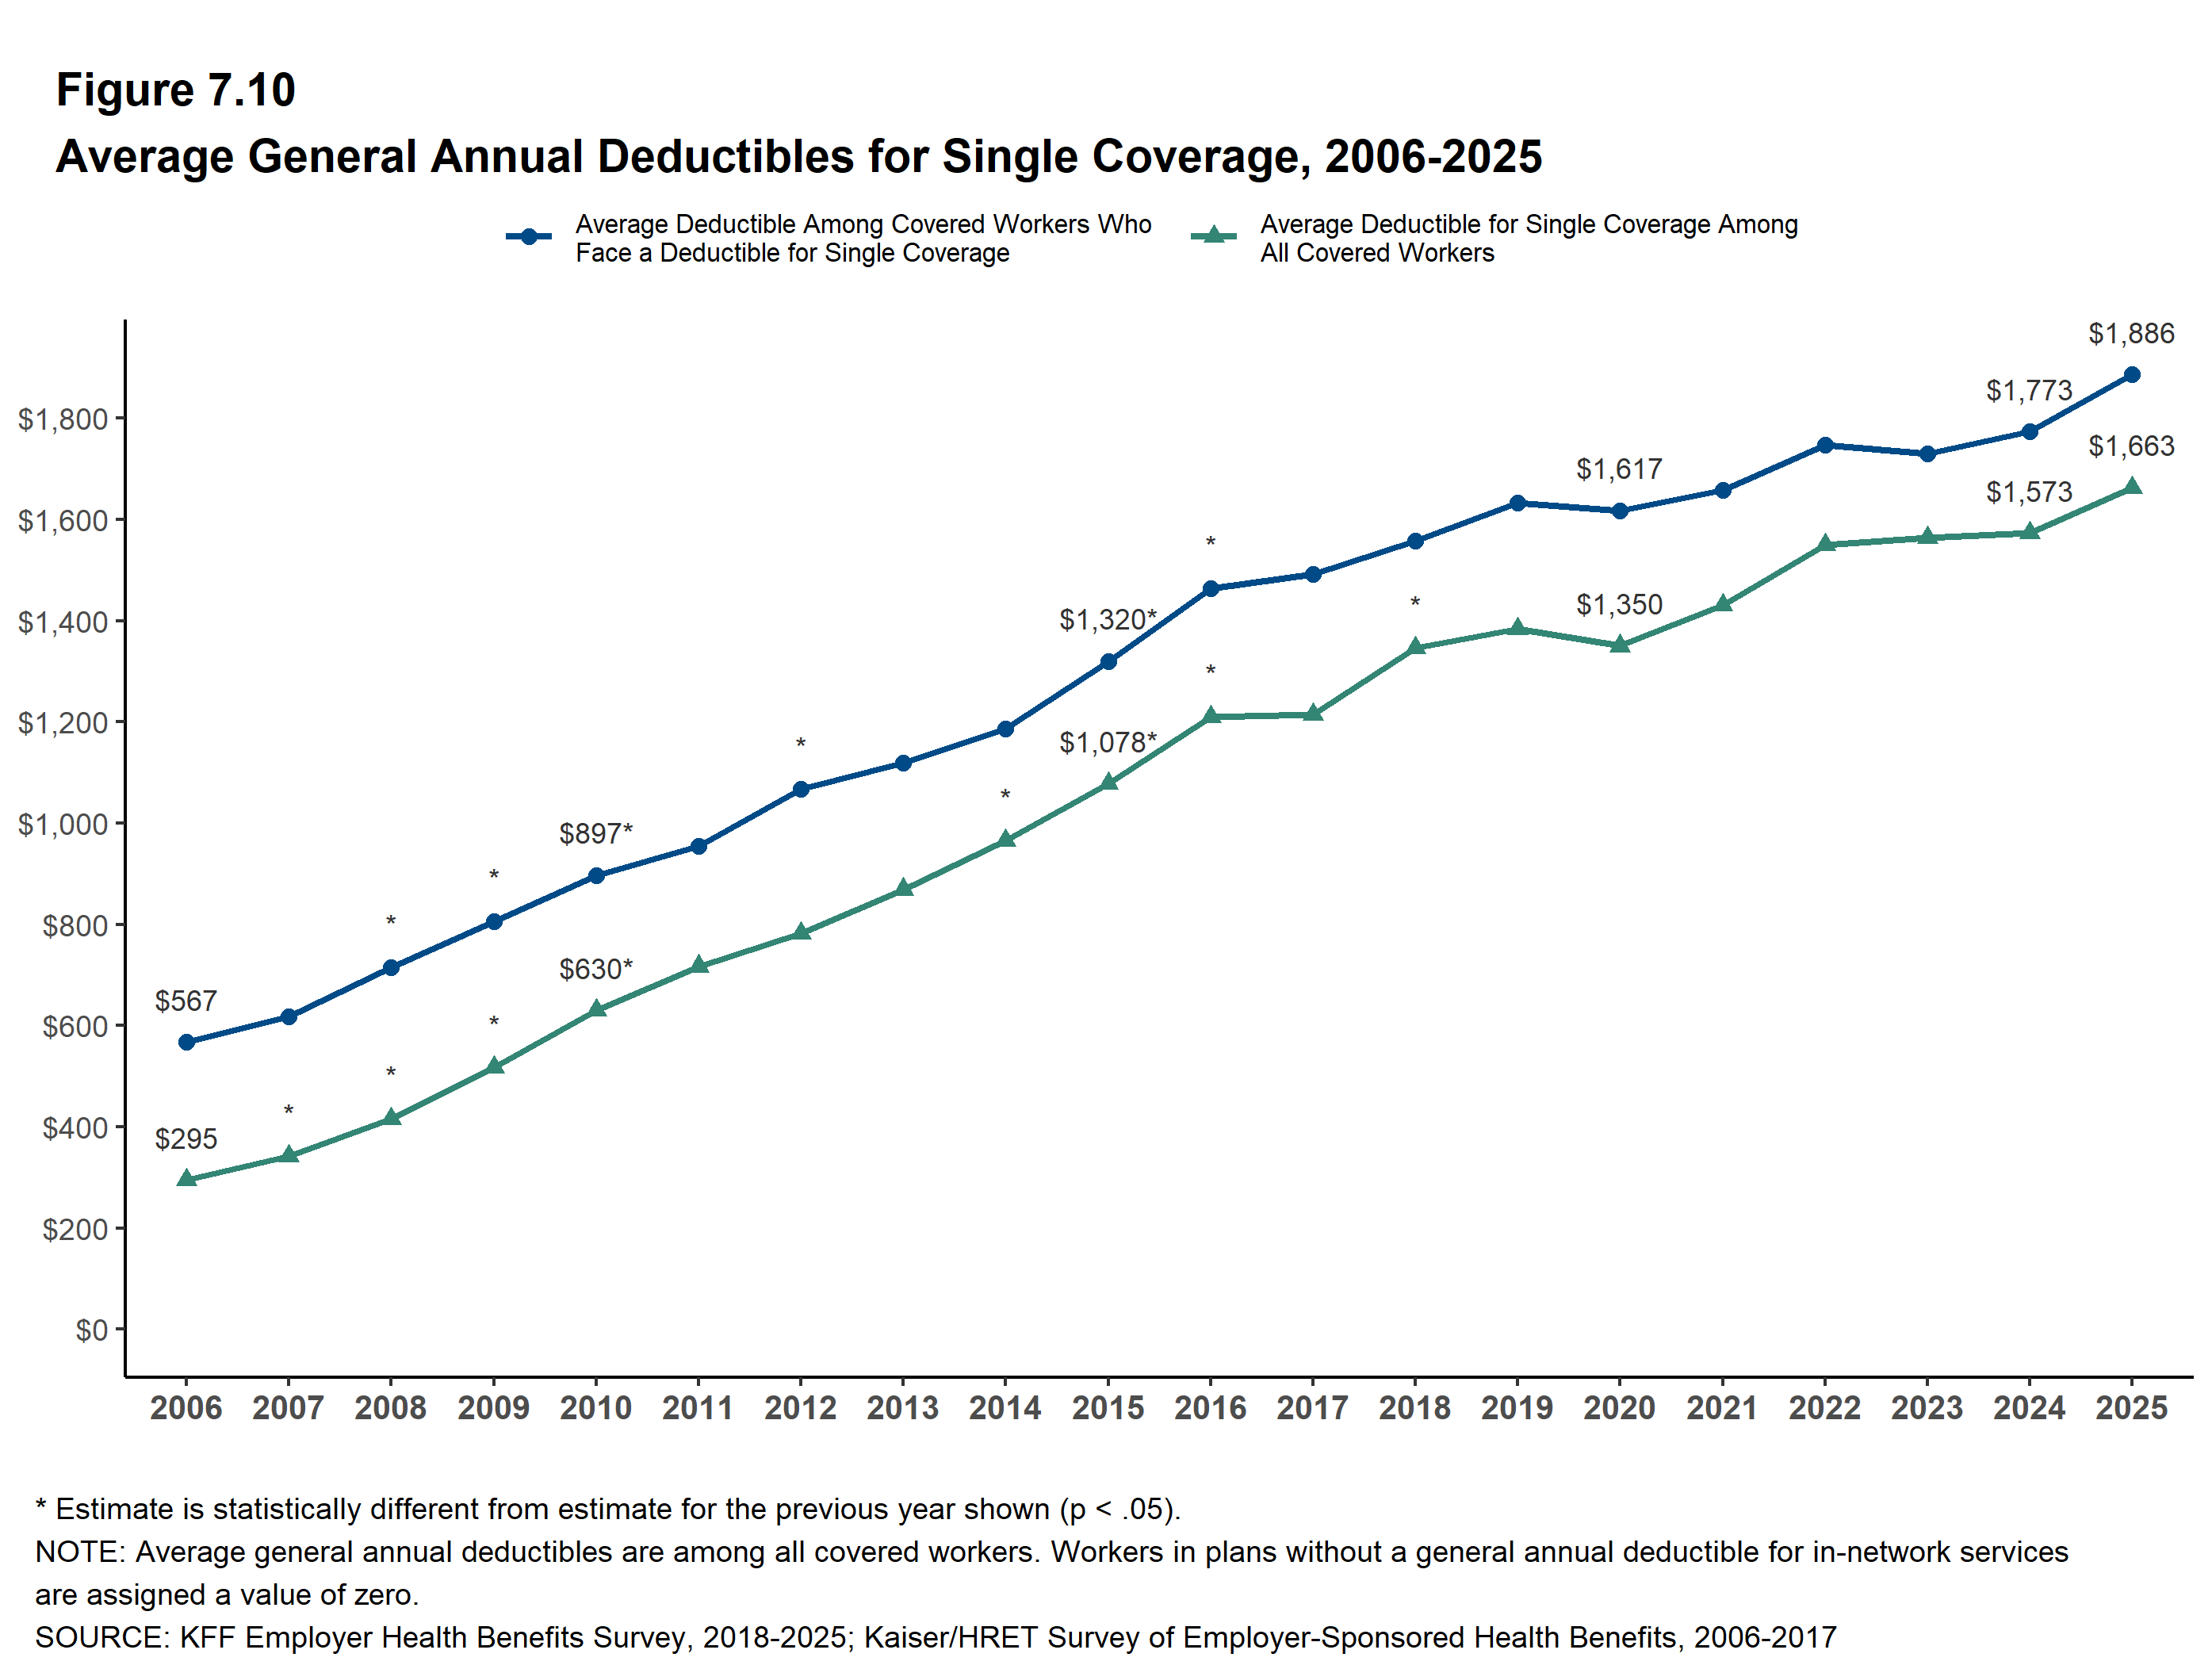
Per person, out-of-pocket spending rose from $701 in 2000 to $1,632 in 2024, about 28% after inflation Modeled [16,17]. The average employer single deductible rose from $567 in 2006 to $1,886 in 2025 [18,19].
So are patients paying a bigger share of the bill?
Out-of-pocket spending fell from 14.5% to 10.5% of all health spending between 2000 and 2024, and for physician and clinical services from 10.9% to 8.5% [16].
Why do industry reports say "patient responsibility" keeps rising?
Vendor reports track the balance owed per bill after insurance, mostly for commercially insured hospital patients, and that has risen [20,21]. Federal data track the share of all spending, which fell as Medicare, Medicaid and Medicare Advantage grew and insurer-paid prices rose faster [16,22].
Are people dropping insurance to pay cash?
Uninsurance hit a record low of 7.6% in 2023 [23], and the 2019 end of the mandate penalty had no measurable coverage effect [24]. In 2026, after enhanced subsidies expired, marketplace enrollment fell 12%, which is too recent to show up in practice data [25].
Are cash-pay patients mostly uninsured?
Most buy access on top of coverage. Most concierge practices still bill insurance for routine services [26].
Why do clinicians leave insurance?
Physicians handle 40 prior authorizations a week, taking 13 hours of physician and staff time [27]. Medicare pay is down 33% after practice-cost inflation from 2001 to 2025 (AMA calculation) [28].
Can patients pay for direct primary care with an HSA?
DPC fees of up to $150 a month for an individual and $300 for a family can be paid from an HSA [29,30,31]. Only people with HSA-qualifying coverage can contribute to an HSA, so this helps insured patients, not the uninsured.
What does this mean for my practice?
Insured patients increasingly pay routine visits out of pocket before their deductible. Facing that cost, they tend to cut back on care and show little sign of shopping [32,33,34], so a specific price before the visit and easy booking are the levers a practice controls. A cash add-on, such as a membership or service line, is where most growth is. Going fully cash means finding patients yourself.
Has the practice mix shifted toward cash? Only in some fields.
Census revenue surveys show how much of each practice type's revenue comes straight from patients. In physician offices it fell, from 10.3% in 2006 to 8.3% in 2015, 7.9% in 2022 and 7.2% in the new 2023 survey [6,8,7]. In chiropractic, therapy and optometry it rose, and cash is already a large share of revenue. Survey definitions changed in 2010, 2015 and 2023, so compare only within a row's consistent years (2015–2022); the appendix lists the breaks.
| Practice type | 2015 | 2022 | 2023 (new survey) |
|---|---|---|---|
| Physician offices, all | 8.3% | 7.9% | 7.2% |
| Physicians, excluding mental health | 8.1% | 7.7% | 6.9% |
| Psychiatrist offices | 20.5% | 20.3% | 25.4% |
| Chiropractors | 32.6% | 41.0% | 46.7% |
| Mental health practitioners (non-MD) | 19.4% | 24.2% | 22.1% |
| Optometrists | 41.0% | 44.8% | 42.1% |
| Dentists | 39.6% | 41.1% | 36.0% |
| Physical, occupational and speech therapy | 8.6% | 9.6% | 9.6% |
Measured Patient out-of-pocket share of revenue, employer firms [8,7]. The 2023 column comes from a new survey with a new benchmark, so treat the change from 2022 as unconfirmed. Psychiatrist offices sat at 20–21% through 2022, and their 2023 value has a 10.5% sampling error.
The modeled share of practices is small but rising. Concierge and DPC sites were about 0.8% of physician-office establishments in 2018 (1,658 of 210,629) and about 1.5% in 2023 (3,036 of 204,617) Modeled [3,4,5]. Physicians in those sites rose from about 2,650 to about 4,190, roughly 0.27% to 0.4% of US physicians Modeled [3,35,36].
This growth is happening against consolidation. Physician-office firms fell 27% from 2008 to 2022 (181,751 to 132,899), while employment in those offices rose 27% from 2008 to 2023 [37,38,39,5]. The share of physicians in practices with fewer than five physicians fell from 40.0% in 2012 to 28.8% in 2024 [40]. Cash practices are growing as the pool of small independent practices shrinks.
Patients pay more dollars, but a smaller share of the bill
Reports of rising patient responsibility and a falling out-of-pocket share are both accurate, because they measure different things. Vendor reports track balances per bill or per visit. TransUnion found average patient responsibility on key procedures at hospitals and clinics up 11% in 2017, from $1,630 to $1,813 per visit [20]. Crowe found insured outpatients' share of the allowed amount rose from 23.3% to 26.9% at about 660 hospitals in 2015–2016 [21]. InstaMed's report is a survey of perceptions: 69% of providers said patient responsibility rose [41]. All three are vendor data, mostly on commercially insured patients, mostly hospital care and mostly from 2012–2018, the steepest deductible years. Federal series instead measure patients' share of all spending, including Medicare and Medicaid. A peer-reviewed claims study of hospital care shows both at once: cost-sharing dollars per enrollee rose 42% from 2012 to 2022, while their share of allowed amounts fell from 10% to 9.2% [22].
In the national accounts, out-of-pocket spending per person rose from $701 in 2000 to $1,632 in 2024, about 28% after inflation Modeled, and total out-of-pocket spending from $197.6B to $556.6B [16,17]. Total health spending grew faster (3.9x against 2.8x), so out-of-pocket fell from 14.5% to 10.5% of the total. For physician and clinical services the share went 10.9% (2000), 9.9% (2005), 8.6% (2019) and 8.0% (2020), then held at 8.5% in 2022–2024: the decline stopped around 2020 [16].
| Out-of-pocket share of spending, by type of service | 2000 | 2024 |
|---|---|---|
| Hospital care | 3.2% | 2.5% |
| Physician and clinical services | 10.9% | 8.5% |
| Prescription drugs (retail) | 31.8% | 11.8% |
| Nursing care facilities | 31.6% | 22.1% |
| Other professional services | 28.9% | 24.2% |
| Dental | 45.1% | 38.3% |
Measured CMS National Health Expenditure accounts [16].
Employer coverage shows the same split. Patients paid about 14% of spending in both 2006 and 2016, and their share fell from 15% to 13% over 2012–2023 [42,43]. The HCCI claims database puts it at 13.6% in 2023 [44]. Inside that share, deductibles rose from 30% to 52% of cost-sharing and copays fell from 43% to 17% (2006–2016) [42]. The patient's slice stayed similar while the pie grew, and more of it arrives as a first-dollar bill.
| Driver of the falling share | Evidence | Status |
|---|---|---|
| Payer mix | Medicare plus Medicaid rose from 28.3% to 33.2% of physician and clinical spending (2005–2019), about 0.9 of the 1.3-point fall Modeled [16] | Shares documented; split inferred |
| Medicaid expansion | Medicaid's share of physician spending rose from 9.0% (2013) to 10.7% (2015), and its cost-sharing is nominal [16,45] | Documented |
| Medicare Advantage | Enrollment rose from 19% (2007) to 54% (2024) [46]. Expected out-of-pocket costs ran 18–24% below traditional Medicare in 2014–2019 [47] | Direction documented; size inferred |
| Prices outpacing cost-sharing | Employer-plan prices rose 17.7% against 1.8% for use (2019–2023), and plan spending rose 27% against 10% for out-of-pocket since 2019 [48,43] | Documented for employer plans |
| Out-of-pocket maximums | Caps limit what the highest spenders pay [44] | Mechanism documented; size inferred |
| Prescription drugs | Drug out-of-pocket share fell from 31.8% to 11.8% (2000–2024) after Part D and the 2025 Medicare cap [16,49]. This lowers the total share, not the physician share | Timing documented; cause inferred |
Cash-pay practices are growing in number but remain 1–2% of physicians
Medicare opt-out counts and share both rose slightly
The CMS Medicare opt-out list is the best proxy for cash-only practice. It held about 3,700 physicians in 2009 and 9,539 in 2012, against roughly 685,000 Medicare-enrolled physicians [50,51]. KFF counts 9,541 non-pediatric physicians (1.0%) in September 2020 and 12,244 in November 2024 [52,53]. The raw CMS files show about 10,900 in April 2023 and 13,840 in August 2026, up 27% Modeled. Family practice rose 44% (2,014 to 2,901) and internal medicine 41% (1,249 to 1,767), against 14% for psychiatry [54,55]. 80.7% of DPC physicians have fully opted out [56].
Total opt-outs across all practitioner types rose from 32,386 in December 2023 to 48,702 in December 2024 and 57,780 by August 2026 [57,58,55]. Most of the jump is counselors and marriage and family therapists (MFTs), whom Medicare began covering in January 2024. They went from essentially zero opt-outs to 7,860 and 6,882. Mental-health practitioners are now 61% of all opt-outs, up from 43% in April 2023.
Physician surveys show no recent surge
Medscape respondents reporting cash-only practice ran 3% (2012), 6% (2014) and 5% (2020), with concierge at 2–3% [60]. The Physicians Foundation found 7.2% (2014), 6.6% (2016) and 6.6% (2018) practicing "some form of concierge and/or direct pay medicine": 14.1% of practice owners and 3.0% of employed physicians [61]. In federal surveys, the share of office-based physicians accepting new privately insured patients rose from 81% in 2011 to 91% in 2019 [62]. Cash practices are mostly physician-owned, and the share of physicians in private practice fell from 60.1% in 2012 to 42.2% in 2024 [63]. Adding never-enrolled DPC and cash physicians to opt-outs gives 15,000–25,000 fully cash physicians, about 1.5–2.5% of roughly one million active physicians Modeled [55,64].
Self-pay visits held near 4%
The federal office-visit survey (NAMCS) records self-pay, no charge or charity as the only payer for about 4% of office visits in 2009–10, 4.3% in 2015–16 and 4.0% in 2019 [65,66,67]. The share held while under-65 uninsurance fell by nearly half. In Epic's records of more than 550 million encounters, self-pay was 1.8% of primary care encounters in Q1 2022 and 1.9% in Q2 2026, while emergency department self-pay rose from 5.5% to 7.6% [68]. Epic links the ED rise to the Medicaid unwinding, which disenrolled at least 25.2 million people [69].
Cash pay is concentrated in mental health, chiropractic and elective care
Psychiatry and therapy. Psychiatrists' acceptance of new privately insured patients fell from 72.3% in 2005–06 to 55.3% in 2009–10 [9]. In a 2023 secret-shopper study of Medicaid managed-care directories, only 17.8% of listed psychiatric prescribers offered a new-patient appointment [71]. Therapists who take no insurance charge a mean $143 per session, against a Medicaid fee of $82.77 [11]. Of the 34% of psychologists who accept no insurance, 48% once did [72].
Chiropractic cash or private-pay cases fell from 24.1% in 1998 to 21.2% in 2003, then rose to 36.3% in 2020 [73,74].
Elective and aesthetic care is cash by definition. Cosmetic procedures rose from 6.75 million in 2000 to 17.7 million in 2018 and IVF cycles from 99,639 to 435,426 by 2022, while LASIK shrank from about 1.4–1.5 million procedures in 2000 to about 833,000 in 2021 [75,76,77,78,13]. Med spas reached 10,488 locations in 2023, and about 30% of weekly Zepbound and 10% of Wegovy prescriptions were cash-pay by late 2025 [79,15].
Mainstream specialties are under 5%: only 1% of OB/GYNs and 4% of surgical specialists decline new privately insured patients [10].
Specialty table: shares, headcounts and gross estimates
Gross = headcount × share Modeled. Cells cite only sources not cited elsewhere.
| Specialty | % cash-only or not accepting insurance | Headcount | Estimated gross number | Trend | Label |
|---|---|---|---|---|---|
| All physicians | 1.2% opted out of Medicare (non-pediatric, 2024). 5% self-report cash-only (2020). 6.6% "some form" concierge or direct pay (2018). 91% accept new private and 89% new Medicare patients (2017–19) | ~1.0M active | 13,840 opted out (Aug 2026). 15,000–25,000 fully cash | Opt-out share 1.0% (2020) to 1.2% (2024). Count +27% (2023–2026) | Opt-out Measured. Fully cash Modeled |
| Psychiatry | 41–45% not accepting private insurance. 8.1% Medicare opt-out | 38,424 (AAMC, 2021 data) | ~15,800–17,200 not taking private insurance. 5,017 opted out | Private acceptance 72.3% to 55.3% (2005–2010), ~59% (2017–19); new Medicare ~60%. Opt-out 7.0% (2017) to 8.1% (2024) [81] | Shares Measured. Gross Modeled |
| Psychologists | 34% (APA 2024). ~43% (Psychology Today 2023) | 75,990 clinical/counseling (BLS) | ~11,700 listed non-accepting. ~25,800 (34% × BLS) | 48% of non-participants left insurance | Directory Measured. BLS-based Modeled |
| Master's-level therapists (LCSW/LPC/LMFT) | ~34% (Psychology Today 2023) | 133,902 listed | ~45,500 listed non-accepting | ~14,700 counselor and MFT Medicare opt-outs after 2024 | Measured |
| Primary care: DPC | ~1% of PCPs. 9% of AAFP survey respondents (2023) [82] | ~422,000 non-DPC PCPs | 3,238 practices (Oct 2026). ~2,800 clinicians (40% of 7,021, 2023) | 125 (2014) to 3,238 (2026) | Practices Measured. Clinicians Modeled |
| Primary care: concierge (mostly hybrid) | Most still bill insurance | n/a | 6,200–6,600 strict concierge physicians. MDVIP 1,400+ | 146 (2005) to ~6,400 (2026) | Vendor Modeled. GAO Measured |
| Family and internal medicine | Medicare opt-out only | 107,510 FM and 67,150 IM (BLS) | 2,901 FM and 1,767 IM opted out | +44% and +41% (Apr 2023–Aug 2026) | Measured |
| Plastic surgery | 4.5% Medicare opt-out. Cosmetic ~100% self-pay | 7,228 | 431 opted out | Cosmetic procedures 6.75M (2000) to 17.7M (2018) | Measured |
| Dermatology | ~2% opted out. Medicaid acceptance 30–34% vs ~91% private [83,84] | 12,767 | 268 opted out | Selective payer, cosmetic cash line | Measured / Modeled |
| Neurology | 3.2% Medicare opt-out | n/a | n/a | n/a | Measured |
| OB/GYN | 1% not accepting new private. 7% not new Medicare | 21,260 (BLS) | 780 opted out | n/a | Measured |
| Orthopedics | 1.1% opted out (Feb 2024) [85] | 14,100 (BLS) | 308 (2024) to 378 (Aug 2026) | Small rise | Measured |
| EM, oncology, radiology, pathology | 0.1% or less opted out. 11 of 26 specialty groups at 0.5% or lower | n/a | Negligible | Small base | Measured |
| Chiropractic | 36.3% of cases cash or private pay (2020). "~25% of DCs essentially cash" (trade claim) [86] | 39,630 (BLS) | ~9,900 if the 25% claim holds | 24.1% (1998) to 21.2% (2003) to 36.3% (2020) | Cases Measured. Gross Modeled |
| Physical therapy | 30% of a section survey out-of-network with all plans | 267,330 (BLS) | Not estimable | 45.5% planned cash services (2021) [87] | Intent surveys only |
| Dental | Out-of-pocket is the largest payer of $189B (2024). 21% of adults 19–64 lack dental benefits [88,89] | 124,390 general dentists (BLS) | Unmeasured | OOP share 48.4% (1990) to 38.3% (2024) [16] | Measured |
| Med spas | ~100% cash | 10,488 locations (2023) | 10,488 | ~1,600 (2010) to 10,488 (2023) | Measured |
| IVF / fertility | 56% of IVF patients had no coverage. 15 states mandate coverage [90] | 457 clinics. 435,426 cycles (2022) | ~240,000 self-paid cycles | 99,639 (2000) to 435,426 (2022) cycles | Modeled |
| LASIK / refractive | ~100% cash | ~833k procedures (2021) | n/a | Peak ~1.4–1.5M (2000) to ~800k | Measured (industry) |
| Weight loss / GLP-1 | ~30% of Zepbound and ~10% of Wegovy weekly scripts cash | n/a | Hims & Hers 2.51M subscribers (all lines) | New since 2024–25 | Measured (IQVIA via Reuters) |
| Ketamine, IV hydration | ~100% cash (inference) | 500–750 ketamine clinics. 488 IV hydration businesses [91] | n/a | Rapid (ketamine), ~2% a year (IV) | Modeled (trade/vendor) |
New cash models grew from almost nothing to thousands of practices
Direct primary care: from about 125 practices to 3,238
DPC charges a flat monthly membership for unlimited primary care and usually bills no insurer. Archived DPC Frontier snapshots show 947 practices (December 2018), 1,374 (December 2020), 1,888 (December 2022), 2,162 (December 2023) and 2,451 (November 2024) [92,93,94,95,96]. Growth slowed from roughly 30–40% a year in 2016–2018 to 13–19% in 2021–2024, then held near 15% Modeled. DPC is still about 1% of primary care physicians: a 2023 analysis counted 2,125 DPC practices against 422,028 non-DPC primary care physicians [97].
In the DPC Alliance's survey of 465 physicians, 82.4% were full owners, 89.3% ran a single site, and two-thirds of panels were not yet full. The average fee was $98.64 per member per month, from $81.56 rural to $110 urban [56]. A Milliman/Society of Actuaries study of one employer found net cost 1.3% higher for DPC members at the midpoint, with a range of −5.2% to +7.8% [109].
Concierge medicine: a retainer on top of insurance
Concierge patients pay a retainer in addition to their coverage. MDVIP, the largest network, grew from about 500 physicians in roughly 2010–11 to 1,000 in 2019 and 1,400+ with 430,000+ members in February 2026 [110,111,112]. From 2018 to 2023, concierge and DPC sites rose from 1,658 to 3,036 (+83%) and clinicians from 3,935 to 7,021 (+78%). The physician share of those clinicians fell from 67.3% to 59.7%, and independent ownership fell from 84% to 60% [3].
Functional medicine, cash surgery and consumer channels
The Institute for Functional Medicine counted about 1,000 certified practitioners worldwide in May 2019 and 1,783 by the end of 2021 [119,120]. At Cleveland Clinic's functional medicine center, opened in 2014, insurance covered 95% of physician visits but only 50% of nutrition visits [121]. The Surgery Center of Oklahoma opened in 1997 and posted all-inclusive prices online around 2008–09; no census of cash-price surgery centers exists [122].
Consumer channels grew fastest. Hims & Hers subscribers rose from 554,000 (2021) to 2.51 million (2025), with $2.35B in 2025 revenue [116,118,123]. Lilly sells self-pay vials at $349–$499 a month [124]. Med spas grew from about 1,600 in 2010 to 10,488 in 2023, averaging $1.4M in revenue each [125,79]. Ketamine clinics numbered 500–750 in 2023 [126]. Testosterone prescriptions rose from 0.76% to 0.98% of the study population from 2018 to 2022, mostly among younger men [127].
Most cash patients are insured and buy access on top of coverage
Insured patients have documented reasons to pay cash. In 9.5 million pharmacy claims, the copay exceeded the drug's cost in 23% [128]. Across 2,379 hospitals, the cash price was below the median negotiated rate in 47% of instances [129]; another study found 60% of negotiated rates above the cash rate [130]. GoodRx reaches 5.3–6.7 million monthly users [131].
| Encounter category (US, per year) | Estimate | Label | Method and assumptions | Sources |
|---|---|---|---|---|
| All office-based physician visits | ~1.0 billion (2019) | Measured | NAMCS | [67] |
| Office visits with no insurance (self-pay or charity only) | ~40M (range 14–112M) | Share Measured, count Modeled | 4.0% × 1.0B. Range from the 95% CI of 1.4–11.2% | [67] |
| Office visits by uninsured persons | ~54M | Modeled | 5.4% (MEPS 2016) × 1.0B | [70] |
| Primary care encounters coded self-pay (EHR) | 1.8% to 1.9% (Q1 2022 to Q2 2026) | Measured | Epic Cosmos, 550M+ encounters | [68] |
| Insured patients paying cash at insurance-accepting practices | ~3M central (range 0.6–8.4M), about 0.3% of all visits | Modeled | Private visits 45.9% × 1.0B ≈ 459M × 34% with deductible ≥$2,000 ≈ 156M × before deductible met (40/50/60%) × practices posting a cash price (10/20/30%) × uptake (10/20/30%) = 0.14% / 0.68% / 1.84% of private visits | [67,132] |
| DPC member encounters (cash-only practices) | ~1.6–5.0M | Modeled | Members 0.8M (2022) to ~1.25M (2,800 clinicians × 445 panel) × 2–4 encounters a year | [3,133] |
| Concierge members paying a retainer on top of insurance | ~1.9–4.0M patients | Modeled | 6,200–6,600 physicians × 300–600 members (MDVIP: 430k ÷ 1,400 ≈ 300). Visits mostly billed to insurance | [64,112] |
| Cash-only psychotherapy sessions | ~28–57M | Modeled | 61,422 listed non-accepting therapists × 10–20 sessions a week × 46 weeks | [11] |
| Cash telehealth subscriptions (Hims & Hers) | 2.51M subscribers (~30M subscription-months) | Measured / Modeled | Subscription-months are not visits | [118] |
| Cosmetic procedures | ~30M (2024) | Measured | 1.6M surgical + 28.5M minimally invasive | [12] |
| Self-paid IVF cycles | ~240,000 | Modeled | 56% uncovered × 435,426 cycles (2022) | [14,77] |
| Laser vision correction | ~833,000 (2021) | Measured | Industry count | [13] |
Most cash encounters happen outside insurance-accepting practices, in psychotherapy, aesthetics, fertility, vision and telehealth, which physician-office surveys miss. About 60% of the concierge and DPC sample in one study still bill Medicare [3], and DPC is usually paired with a wraparound insurance plan [134].
Clinicians leave insurance over prior authorization, falling Medicare pay and administrative cost
US practices spent an estimated $82,975 per physician per year dealing with payers in 2011, against $22,205 in Ontario [135]. Medicare's 2027 proposed conversion-factor cut follows a temporary 2026 bump [136]. The table below lists each push and pull factor.
Concierge and DPC practices owned by for-profit corporations (excluding hospitals and health systems) grew 576%, from 152 to 1,027 between 2018 and 2023. Across all concierge and DPC practices, advanced practice clinicians rose from 33% to 40% of clinicians [3]. Rural DPC fees run about $28 a month below urban fees [56]. Some factors slow growth. A Medicare opt-out lasts two years and renews automatically [140]. Early DPC practices Qliance and Turntable Health closed in 2017 [141]. Researchers warn that fee-based growth shrinks access for patients who can afford only covered care [142].
| Factor | Key figure | Label | Direction | Sources |
|---|---|---|---|---|
| Prior authorization burden | 40 PAs and 13 hours a week. 94% say PA drives burnout. 26% report a serious adverse event | Measured (survey) | Push, steady | [27] |
| Billing and insurance overhead | $20.49 and 13 minutes per primary care visit (14.5% of professional revenue). $82,975 per physician a year (2011). $68,274 (2009) | Measured | Push, structural | [143,135,144] |
| Claim denials | 1 in 5 in-network marketplace claims denied (2023) | Measured | Push | [145] |
| Real Medicare pay decline | −33% (2001–2025, MEI-adjusted, AMA). 2027 proposed conversion factor −1.68% | Measured (advocacy calculation) | Push, worsening | [28,136] |
| Burnout and autonomy | Burnout 62.8% (2021) to 43.2% (2024). Bureaucracy the top cause (62%). Private practice 60.1% to 42.2% | Measured | Push | [138,146,63] |
| Time with patients | DPC panels 400–700 vs 2,000+ in fee-for-service (26.2% of family physicians at 2,001–3,000). 85% of DPC doctors cite visit time, 10% income | Measured / unverified | Pull | [56,147,148] |
| Low mental-health reimbursement | 82% of non-participating psychologists cite low pay, 62% administrative burden. Cash $143 vs Medicaid $82.77 per session | Measured | Push | [72,11] |
| Patient deductibles and HSAs | 34% of workers have a deductible ≥$2,000. HSAs hold $174B. DPC HSA-eligible from 2026 | Measured | Demand, rising in 2026 | [132,149,30] |
| Cash cheaper than insured price | Copay above drug cost in 23% of claims. Cash below negotiated rate in 47% of hospital prices | Measured | Demand | [128,129] |
| Services insurance excludes | Cosmetic ~30M procedures. 56% of IVF patients uncovered. GLP-1 cash share 10–30% | Measured / Modeled | Demand, new categories | [12,14,15] |
| Corporate and investor capital | Corporate-owned concierge and DPC practices 152 to 1,027 (2018–2023) | Measured | Supply expansion | [3] |
| Enabling policy | State DPC laws 17 (2016) to 34 (2025). OBBBA HSA-DPC rule (2026) | Measured | Enabler | [150,151,31] |
Patients face higher deductibles, but coverage stayed high through 2025
Deductibles tripled, mostly before 2016
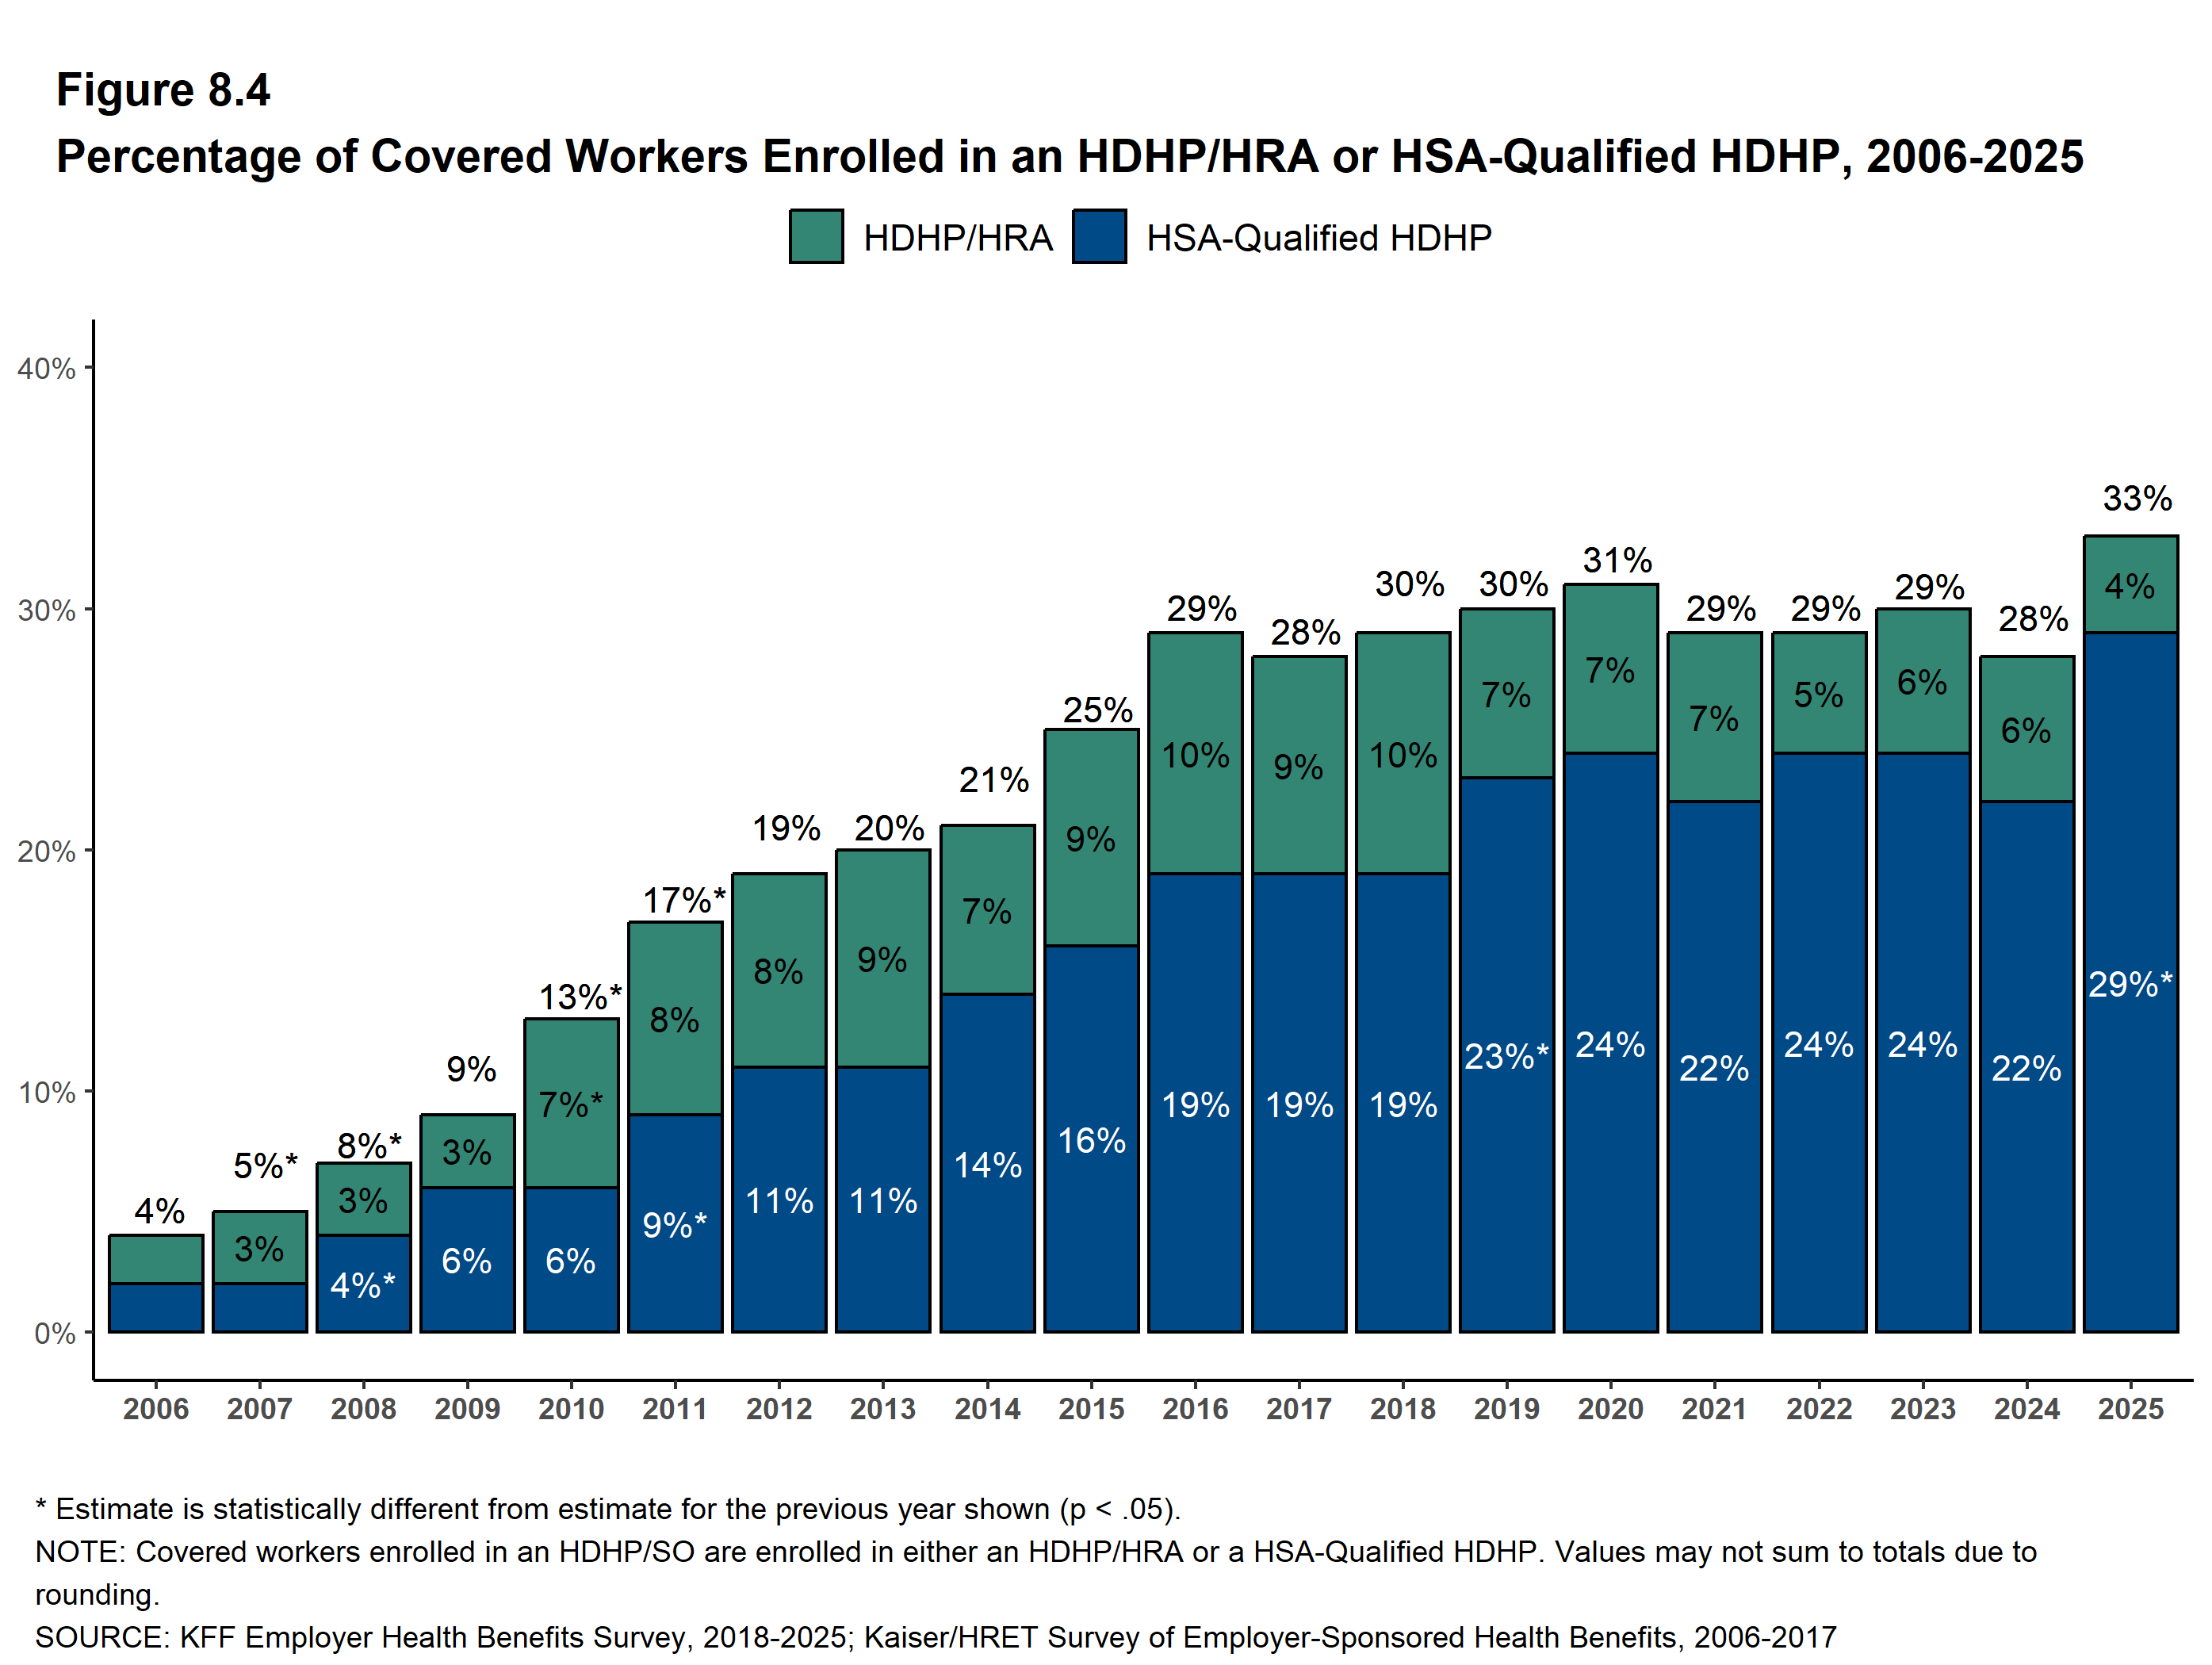
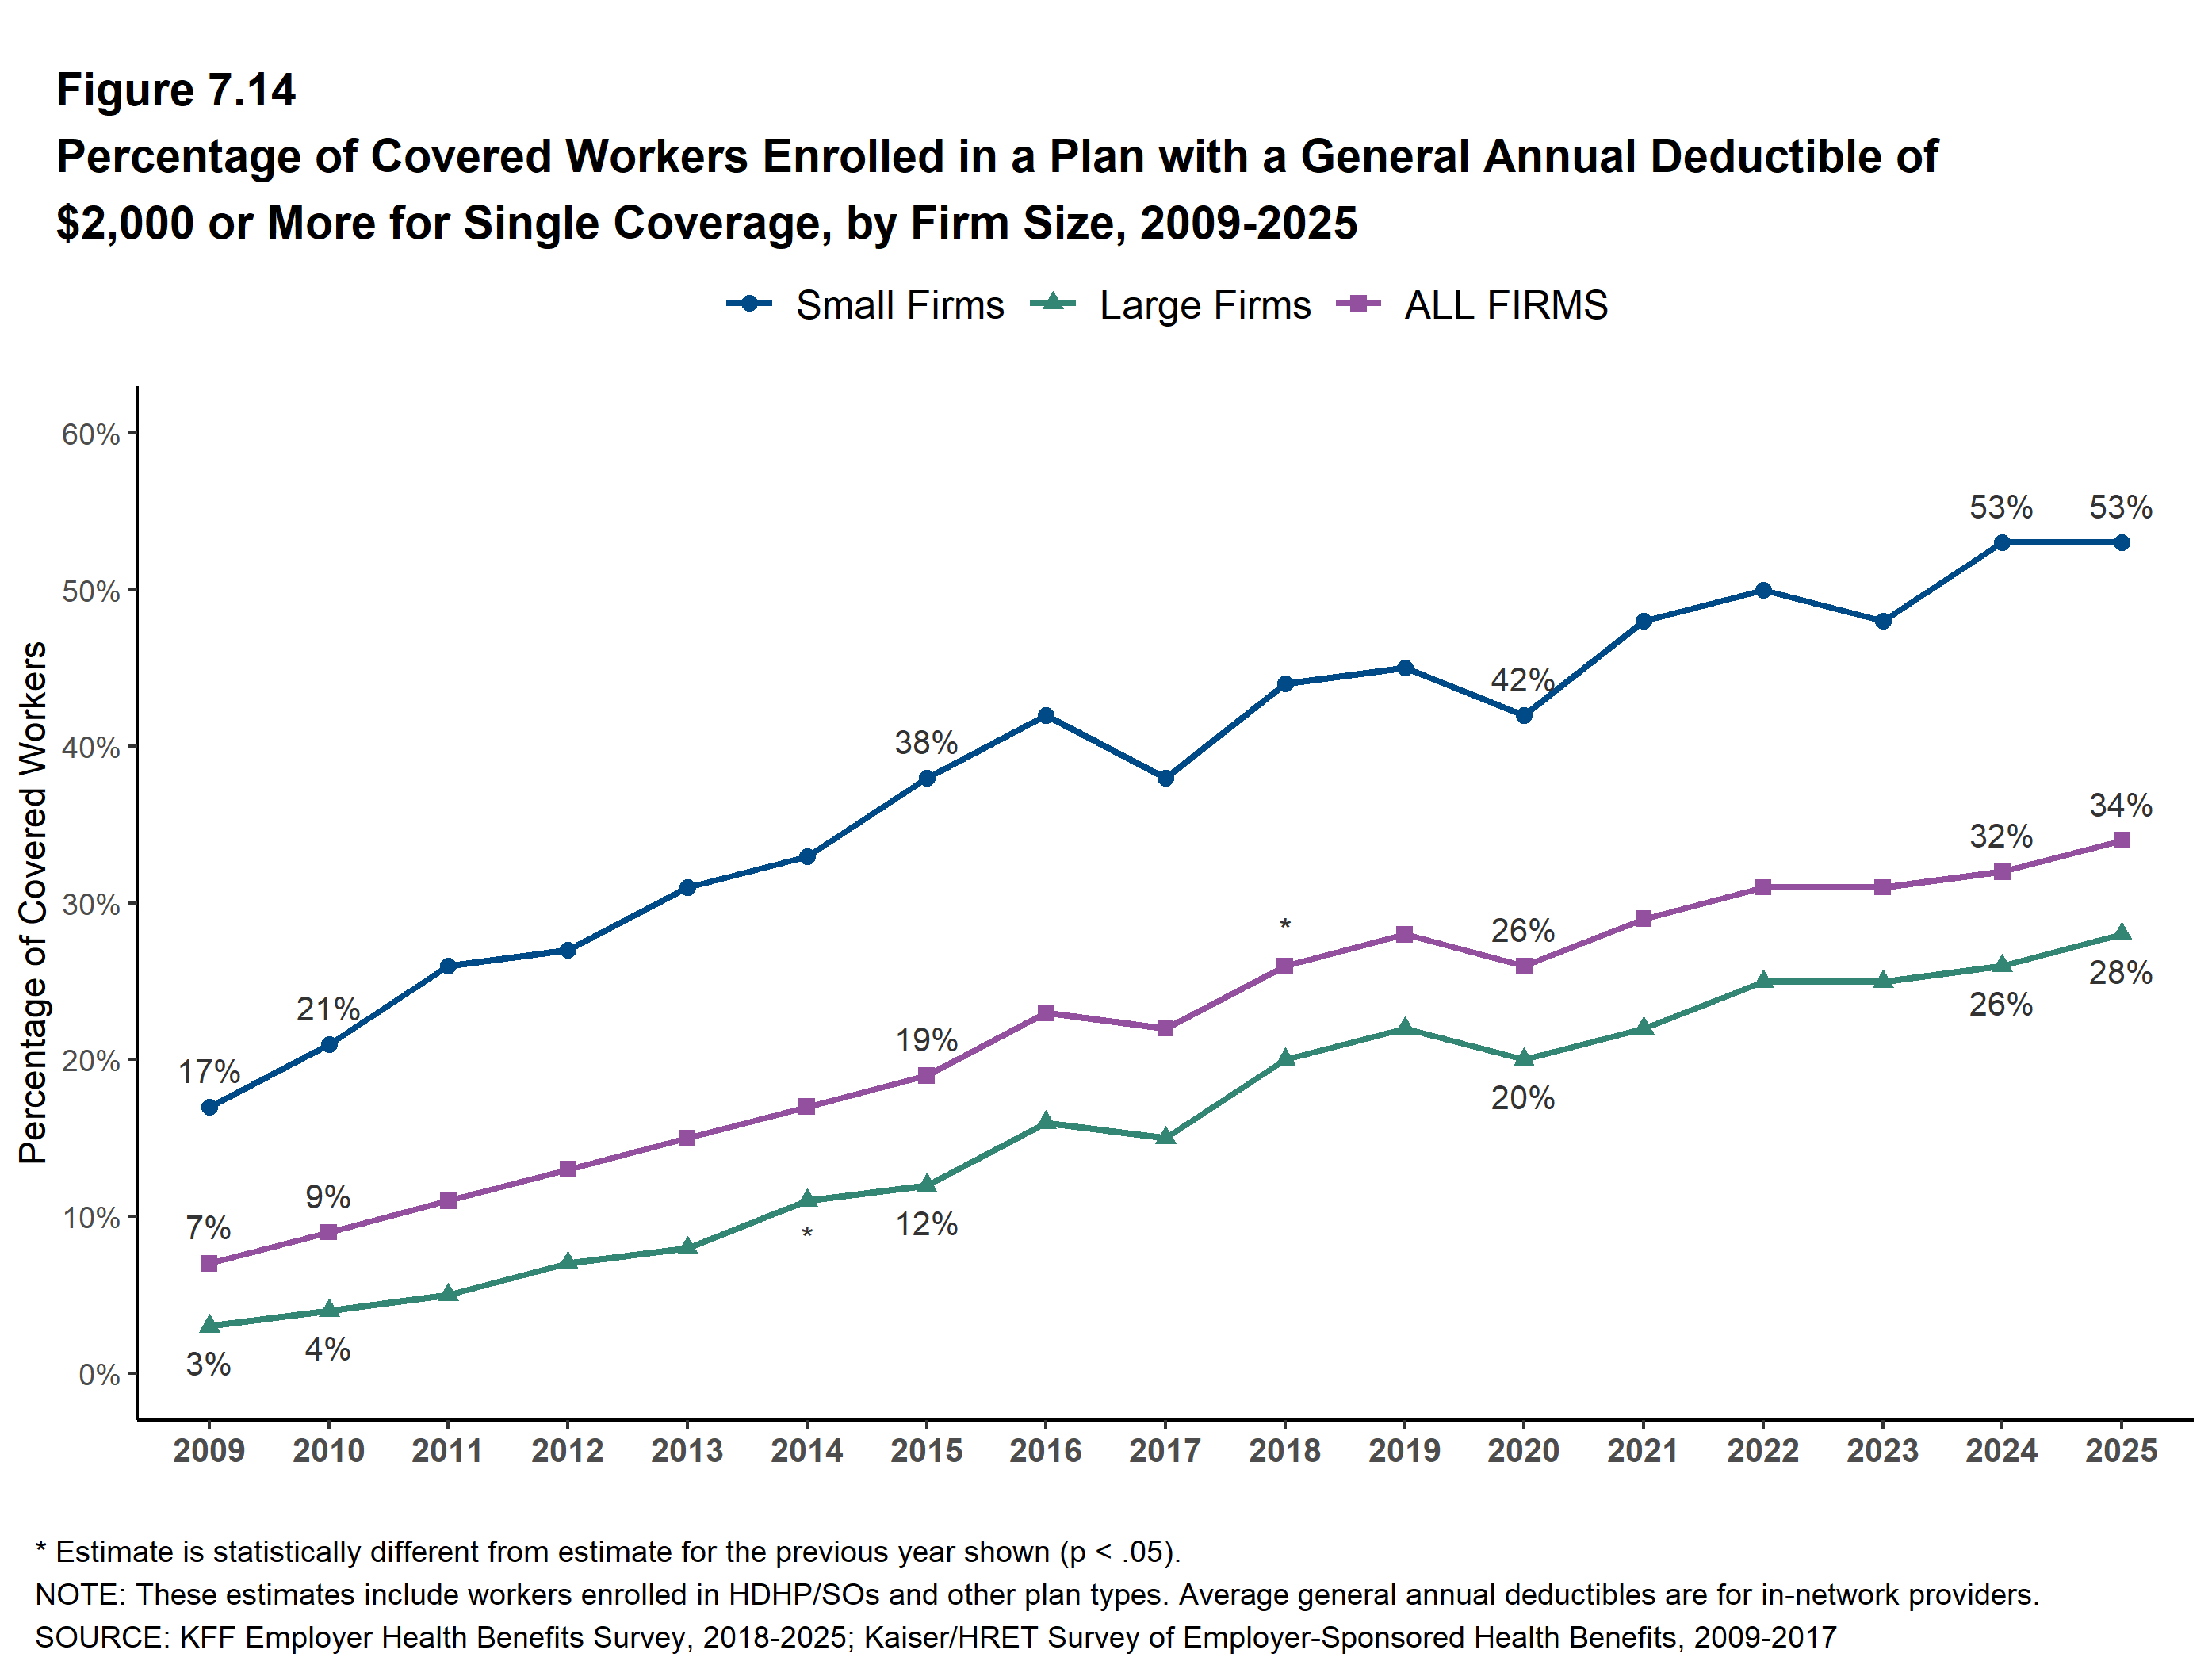
Among workers with a deductible, the average single deductible was $1,320 in 2015 and $1,617 in 2020, a 3.3x rise over 2006–2025 [18]. Counting workers with no deductible as $0, it rose 5.6x, from $295 to $1,663, and 88% of single-coverage workers now face a deductible [132]. HDHP/SO enrollment (a high-deductible plan paired with an HSA or HRA) rose from 4% to 29% between 2006 and 2016, stayed at 28–31% through 2024, and reached 33% in 2025 [152]. The share facing a deductible of $2,000 or more went from 7% in 2009 to 34% in 2025; among small-firm workers it is 53% [153]. From 2020 to 2025 the single deductible rose 17%, slower than wages (+28.6%) and inflation (+23.5%) [19].
Underinsurance rose and many patients skip care
Among adults insured all year, the Commonwealth Fund's underinsured share rose from 12% in 2003 to 28% in 2016 [154]. Among all adults 19–64 it was 21.3% in 2018 and 2020 and 23% in 2022 and 2024 [155,156,157]. In 2024, 57% of the underinsured avoided needed care because of cost, and two-thirds of them had employer coverage [33]. HDHP enrollees without an HSA make fewer primary care visits [32], and primary care office visits by adults with employer coverage fell 18% from 2012 to 2016 [158]. No peer-reviewed study shows high deductibles causing a switch to cash or DPC practices; the measured response is mostly skipped care.
Uninsurance fell to a record low after the 2019 mandate repeal
CBO projected that zeroing the mandate penalty would cut non-group enrollment about 18% in 2019 and 28% by 2021 [159]. Instead, private coverage and marketplace enrollment for ages 18–64 "do not appear to have changed" [24], though individual-market enrollment fell about 5% in early 2019 among mostly unsubsidized buyers [160]. NHIS under-65 uninsurance rose from 10.3% (2016) to 12.0% (2019), then fell to 10.2% by 2022; over 2010–2025 it fell from 18.2% to about 10% [161]. The all-ages rate was 8.3% (28.0 million) in 2025 [23,162]; Census put it at 7.9% [163]. Health-care sharing ministry membership grew from about 200,000 in 2010 to about 1 million by 2018, well under 1% of the population [164].
In 2026 marketplace deductibles jumped, enrollment fell and DPC became HSA-eligible
The average marketplace deductible went from $2,759 to $3,786, the largest increase on record. Bronze plans rose from 30% to 40% of selections (about 9.2 million people), silver fell to a record-low 43%, and average enrollee premium payments rose 58% [165]. Effectuated enrollment fell 12%, from 21.8 million to 19.2 million. Enrollees above the subsidy cliff were 7% of 2025 enrollment but 48% of the decline [25,166]. CBO projects the One Big Beautiful Bill Act (OBBBA) will add about 10 million uninsured by 2034, 7.5 million of them from Medicaid changes [167].
OBBBA also made every bronze and catastrophic marketplace plan HSA-eligible. From January 2026, DPC fees of up to $150 a month individual and $300 family can be paid from an HSA [29,30,31]. HSAs held $174B across 41.7 million accounts at the end of 2025 [149]. Only people with HSA-qualifying coverage can contribute, so the rule helps those insured people, not the uninsured. None of these 2026 changes shows in practice counts yet.
What this means for private practices
The take-home: cash pay is growing as an add-on to insurance and in specific fields. Insured patients pay more dollars for routine visits because of bigger deductibles, even though insurers pay a growing share overall. They tend to cut back on care rather than shop, so the practice's lever is a specific price before the visit and easy access.
If you are in chiropractic, therapy or optometry, cash is already a large share of revenue in your field, up from 2015 to 2022: 41.0% for chiropractors, 24.2% for non-physician mental health practitioners and 44.8% for optometrists in 2022 [8].
Cash pay is a layer on top of insurance, not a replacement for it. Most concierge practices still bill insurance for routine services [26], and about 60% of the concierge and DPC sample in one study bill Medicare [3].
More insured patients pay the first dollars of routine care. Workers with a single deductible of $2,000 or more went from 7% in 2009 to 34% in 2025 [153,132]. Bronze plans rose from 30% to 40% of 2026 marketplace selections [165].
High deductibles mostly lead to skipped care [32,33]. When one large employer moved all its workers to a high-deductible plan, spending fell and patients cut care, with no sign they learned to compare prices even two years later [34]. Use of a marketwide price-transparency tool was low [168]. The better-supported lever is a specific number at the point of decision, such as an estimate or a quoted self-pay rate, plus easy access. No study yet measures whether that reduces skipped visits.
An insured patient who chooses to pay cash instead of using insurance counts as self-pay under the No Surprises Act, so the practice may owe a Good Faith Estimate before scheduled care [169]. Check payer contracts too: some limit billing a covered patient outside the contracted terms.
A practice that leaves insurance also leaves payer directories and must find patients directly. Two-thirds of DPC panels were not yet full in the DPC Alliance survey [56].
From 2026, insured patients with HSA-eligible plans can pay DPC fees of up to $150 a month from an HSA [31].
One caveat: across medicine, patients' out-of-pocket share of physician and clinical spending fell from 9.9% in 2005 to 8.5% in 2024 [16].
What to watch
| Release | What it will show | Current value |
|---|---|---|
| Monthly CMS Medicare opt-out files | Whether physician opt-outs accelerate beyond ~+27% over 2023–2026 | 13,840 non-pediatric physicians (Aug 2026) |
| 2026 NHIS and Census uninsured estimates (due 2027) | Whether subsidy expiry and Medicaid changes raise uninsurance | 8.3% NHIS, 7.9% Census (2025) |
| First measured uptake of HSA-paid DPC | How many HSA holders use the new rule | Not yet measured |
| Epic primary-care self-pay share | Whether cash primary care grows inside mainstream practice | 1.9% (Q2 2026) |
| DPC Frontier mapper | Whether DPC growth departs from ~15% a year | 3,238 practices (Oct 2026) |
Appendix: data quality and methodology
No source counts practices that accept no insurance, so every measure here is a proxy.
| Series | Years | Type | Label | Quality notes |
|---|---|---|---|---|
| CMS Medicare opt-out affidavits | 2009, 2012 (via WSJ). Monthly Apr 2023–Aug 2026 | Administrative | Measured. Physician counts Modeled | Counts individuals, not practices. A lower bound: never-enrolled cash doctors are absent. 2009 and 2012 figures may mix annual and cumulative counts. Tabulated counts are within ±0.3% and about 1% of KFF's late-2024 figure. The 2024 jump is counselors and MFTs, so "opt-outs doubled" is not about physicians. Specialty labels are self-reported |
| KFF opt-out shares | 2013, 2020, 2022, 2024 | Administrative ÷ AMA Masterfile | Measured | Consistent non-pediatric definition. Best trend points |
| NAMCS / NEHRS (CDC) | 1990–2019 | Federal probability survey | Measured | 2019 no-insurance share fails NCHS reliability standards (95% CI 1.4–11.2%). 1990 "self-pay" not comparable. "Not accepting new insured patients" includes full panels and out-of-network billing, so it is a ceiling. No post-2019 psychiatry figures [170] |
| Epic Research (Cosmos) | 2022–2026 | EHR records | Measured | Self-pay as primary payer. Contributor base changes over time |
| CMS National Health Expenditures | 1960–2024 | National accounts, current vintage | Measured | "Out-of-pocket" mixes insured cost-sharing with true self-pay and excludes premiums. Medigap cost-sharing counts as private insurance [171]. Physician and clinical out-of-pocket is a residual partly built from Census Service Annual Survey distributions, so the NHE and Census shares are not independent confirmations. Physicians salaried by hospitals count as hospital care (2.5% out-of-pocket). The older Health, United States vintage showed 7.9% for 2019 [172] against 8.6% now; the two are not spliced |
| Census Service Annual Survey / AIES payer revenue | 2006–2023 | Federal revenue survey | Measured, shares computed | Three definitional breaks (about 2010, 2015, 2023) plus benchmark revisions between releases: in 2010 the redesign alone moved about 1 point out of physician out-of-pocket [6,173]. Employer firms only, so solo practices with no employees are excluded (621111 nonemployer receipts were $17.4B in 2022 against $590.9B for employer firms) [174]. No membership-fee line, so patient-paid DPC and concierge fees may be classed as out-of-pocket while employer-paid contracts land in "other" (unconfirmed). Several 2024 cells are suppressed, and 2023 is a new survey and benchmark |
| Census CBP / SUSB / AMA practice size | 2008–2024 | Federal establishment and firm counts, physician survey | Measured | CBP counts payroll establishments and SUSB counts firms, neither equal to the directory "sites" in the Health Affairs series. The 2021 drop in physician-office establishments is unexplained. AMA size is firm-wide and surveys physicians, not practices. The AAMC 2023 and FSMB 2018 headcounts were read from summaries |
| Modeled concierge and DPC shares | 2018, 2023 | This report | Modeled | Sites divided by CBP physician-office establishments (0.8%, 1.5%). Adding nonemployer establishments to the denominator gives 0.43% and 0.78% [174]. Denominators include specialists, so the share of primary care is higher. The numerator is a self-described lower bound. Physicians are clinicians times the physician share |
| Vendor patient-responsibility reports | 2012–2018 | Vendor data and surveys (TransUnion, Crowe, InstaMed) | Modeled | Proprietary and unaudited. Per-bill or per-visit balances, mostly commercially insured hospital patients. TransUnion does not define "per visit". No vendor publishes a physician-office share series |
| Employer cost-sharing (Peterson-KFF, HCCI) | 2006–2023 | Claims databases | Measured | Commercial claims only. No published series for physician services specifically |
| KFF Employer Health Benefits Survey | 2006–2025 | Employer survey | Measured, some Read-from-chart | 2025 restatement dropped 3–9-worker firms; this report uses it. Earlier vintages differ by $10–30 (2006 first published as $584) |
| NHIS uninsured | 2000–2025 | Federal survey | Measured | 2019 redesign break. Long-term and Early Release products differ slightly |
| Commonwealth Fund underinsured | 2003–2024 | Opt-in panel survey | Measured | Two denominators. The often-quoted "12% to 23%" splices them |
| DPC directories | 2014–2026 | Volunteer and vendor directories | Measured | Self-listed, primary care only. 2019 platform change. Directories disagree (2,663 to 3,600+) [175,108] |
| Health Affairs concierge + DPC | 2018–2023 | Peer-reviewed, NPPES-linked | Measured | Best independent series. A self-described lower bound |
| Physicians Foundation, Medscape | 2012–2020 | Opt-in physician surveys | Measured | Include hybrid practices. Questions dropped after 2018–2020 |
| Psychology Today, APA, AOPT | 2023, 2024 | Directory and member surveys | Measured | Self-selected (175,083 listings scraped). No time series. The PT figure is an orthopedic-section survey [80] |
| AMA pay and prior-authorization series | 2001–2025 | Advocacy calculations and surveys | Measured | Published by an advocacy organization |
| Vendor and trade counts | Various | Vendor | Modeled | NextMD, Hint, AmSpa, IBISWorld, sharing-ministry counts. Commercial interest, conflicting definitions. Use as ranges |
| BLS OES headcounts | 2024–2025 | Employer survey | Measured | Employees only, so a floor (psychiatrists 27,980 vs AAMC 38,424) [176,177] |
| Encounter and gross-number models | 2026 | This report | Modeled | Headcount × share from different years and frames. No survey measures insured patients paying cash at a physician's office. Psychotherapy estimate excludes cash clients of insurance-accepting therapists. Order of magnitude only |
References
- Elation Health / Hint DPC Trends (2018) https://www.elationhealth.com/resources/blogs/how-fast-is-direct-primary-care-growing
- DPC Frontier Mapper (live, Oct 2026) https://mapper.dpcfrontier.com/
- Zhu et al., Health Affairs 2025 (concierge + DPC growth) https://europepmc.org/api/getPdf?pmcid=PMC12965179
- Census County Business Patterns 2018, national file https://www2.census.gov/programs-surveys/cbp/datasets/2018/cbp18us.zip
- Census County Business Patterns 2023, national file https://www2.census.gov/programs-surveys/cbp/datasets/2023/cbp23us.zip
- Census Service Annual Survey 2010, Tables 8.1 and 8.10 (2006–2010) https://www2.census.gov/programs-surveys/services/tables/2010/sas/sas-10.pdf
- Census AIES 2023, Revenue by Type of Payer (health care) https://www2.census.gov/programs-surveys/aies/data/2023/AIES62TYPEPAYER.zip
- Census Service Annual Survey 2022, Table 4 (revenue sources, 2013–2022) https://www2.census.gov/programs-surveys/sas/tables/time-series/sas-latest/sas-22.xlsx
- Bishop et al., JAMA Psychiatry 2014 https://pmc.ncbi.nlm.nih.gov/articles/PMC3967759
- KFF, Most office-based physicians accept new patients (NEHRS 2017+2019) https://www.kff.org/medicare/issue-brief/most-office-based-physicians-accept-new-patients-including-patients-with-medicare-and-private-insurance
- Zhu et al., Health Affairs Scholar 2024 (Psychology Today directory) https://pmc.ncbi.nlm.nih.gov/articles/PMC11412241/
- ASPS Plastic Surgery Statistics Report 2024 https://www.plasticsurgery.org/documents/news/statistics/2024/plastic-surgery-statistics-report-2024.pdf
- Refractive Surgery Council, Q3 2021 volume https://americanrefractivesurgerycouncil.org/press-room/rsc-released-q3-2021-lvc-procedure-volume
- FertilityIQ, paying for IVF (patient survey) https://fertilityiq.com/cost/paying-for-ivf-with-a-loan-or-credit-card
- Reuters via BNN Bloomberg, GLP-1 cash pay (Dec 2025) https://www.bnnbloomberg.ca/business/2025/12/29/pills-tiktok-and-weight-loss-apps-the-consumer-driven-future-of-glp-1s/
- CMS NHE by type of service and source of funds, 1960–2024 (NHE2024.csv) https://www.cms.gov/files/zip/national-health-expenditures-type-service-source-funds-cy-1960-2024.zip
- BLS Consumer Price Index https://www.bls.gov/cpi/
- KFF EHBS 2025, Figure 7.10 (deductibles 2006–2025) https://www.kff.org/wp-content/uploads/sites/7/2025/10/Figure-7-10_836194.png
- KFF Employer Health Benefits Survey 2025 https://www.kff.org/health-costs/report/2025-employer-health-benefits-survey/
- TransUnion, patient payment responsibility up 11% in 2017 (vendor) https://newsroom.transunion.com/patient-payment-responsibility-increases-11-in-2017/
- Crowe Revenue Cycle Analytics, Q3 2016 (vendor) https://crowe.com/news/rca-q3-2016
- Duffy, Ly & Trish, Health Affairs 2026, hospital cost-sharing 2012–2022 https://www.healthaffairs.org/doi/10.1377/hlthaff.2025.01340
- NCHS NHIS Early Release, Health Insurance 2025 https://cdc.gov/nchs/data/nhis/earlyrelease/Health-Insurance-Coverage-Early-Release-of-Estimates-2025.pdf
- Oyeka, Lyu & Wehby 2022, effects of repealing the mandate https://iro.uiowa.edu/esploro/outputs/journalArticle/Effects-of-Repealing-the-ACA-Individual/9984295039502771
- KFF, marketplace enrollment change by state 2026 https://www.kff.org/affordable-care-act/how-has-aca-marketplace-enrollment-changed-across-states-in-2026/
- Physicians Practice, Concierge medicine growing https://www.physicianspractice.com/view/concierge-medicine-growing
- AMA 2025 prior authorization survey (May 2026) https://www.ama-assn.org/press-center/ama-press-releases/ama-survey-prior-authorization-reform-pledge-falls-short-physicians
- AMA, Medicare physician pay has plummeted since 2001 https://www.ama-assn.org/practice-management/medicare-medicaid/medicare-physician-pay-has-plummeted-2001-find-out-why
- Venable, OBBBA health provisions https://www.venable.com/insights/publications/2025/07/the-one-big-beautiful-bill-has-arrived-heres-what
- IRS newsroom, HSA guidance under OBBBA https://www.irs.gov/newsroom/treasury-irs-provide-guidance-on-new-tax-benefits-for-health-savings-account-participants-under-the-one-big-beautiful-bill
- IRS Notice 2026-5 https://www.irs.gov/pub/irs-drop/n-26-05.pdf
- AAFP / Graham Center HDHP study (2018) https://www.aafp.org/news/practice-professional-issues/20180612hdhpstudy.html
- Commonwealth Fund 2024 press release https://www.commonwealthfund.org/press-release/2024/new-survey-nearly-1-4-adults-health-coverage-struggle-high-out-pocket-costs-and
- Brot-Goldberg et al., What Does a Deductible Do?, QJE 2017 (NBER w21632) https://www.nber.org/papers/w21632
- FSMB physician census 2018 (licensed physicians) https://preproduction.fsmb.org/physician-census/
- AAMC 2024 key findings on the physician workforce https://www.aamc.org/data-reports/data/2024-key-findings-and-definitions
- Census SUSB 2008, US by 6-digit NAICS https://www2.census.gov/programs-surveys/susb/tables/2008/us_6digitnaics_2008.xls
- Census SUSB 2022, US and state by 6-digit NAICS https://www2.census.gov/programs-surveys/susb/tables/2022/us_state_6digitnaics_2022.txt
- Census County Business Patterns 2008, national file https://www2.census.gov/programs-surveys/cbp/datasets/2008/cbp08us.zip
- AMA Physician Practice Characteristics in 2024 https://www.ama-assn.org/system/files/2024-prp-pp-characteristics.pdf
- InstaMed, ninth annual Trends in Healthcare Payments report (vendor survey) https://www.carrickcapitalpartners.com/instamed-releases-ninth-annual-trends-in-healthcare-payments-report
- Peterson-KFF, cost-sharing payments vs wage growth 2006–2016 https://www.healthsystemtracker.org/brief/increases-in-cost-sharing-payments-have-far-outpaced-wage-growth/
- Peterson-KFF, employer-plan out-of-pocket cost sharing 2012–2023 https://www.healthsystemtracker.org/chart-collection/how-much-do-people-with-employer-plans-spend-out-of-pocket-on-cost-sharing/
- Managed Healthcare Executive, HCCI CEO on out-of-pocket costs (2026) https://www.managedhealthcareexecutive.com/view/katie-martin-drug-spending-out-of-pocket-costs
- Medicaid.gov, cost sharing and out-of-pocket costs https://www.medicaid.gov/medicaid/cost-sharing/cost-sharing-out-pocket-costs/index.html
- KFF, Medicare Advantage enrollment share https://www.kff.org/medicare/medicare-advantage-is-close-to-becoming-the-predominant-way-that-medicare-beneficiaries-get-their-health-coverage-and-care/
- USC Mann summary, Medicare Advantage vs traditional Medicare out-of-pocket https://mann.usc.edu/?p=58745
- HCAmag, HCCI 2019–2023 prices vs utilization https://www.hcamag.com/us/specialization/benefits/your-health-plan-is-losing-the-price-war-and-new-data-shows-why/593360
- ASPE, Medicare Part D enrollee out-of-pocket spending (IRA) https://www.aspe.hhs.gov/reports/medicare-part-d-enrollee-out-pocket-spending
- Columbia Journalism Review on WSJ/CMS opt-out data (2013) https://www.cjr.org/the_second_opinion/how_many_doctors_still_take_medicare.php
- FierceHealthcare, Medicare opt-outs tripled (2013) https://www.fiercehealthcare.com/practices/medicare-opt-outs-tripled-3-years
- KFF opt-out brief, 2020 version (Wayback) https://web.archive.org/web/2021/https://www.kff.org/medicare/issue-brief/how-many-physicians-have-opted-out-of-the-medicare-program/
- KFF, How Many Physicians Have Opted Out of Medicare? (Jan 2025) https://www.kff.org/medicare/issue-brief/how-many-physicians-have-opted-out-of-the-medicare-program/
- CMS Opt-Out Affidavits, April 2023 CSV https://data.cms.gov/sites/default/files/2023-05/02e85de4-9c70-4d8f-84eb-6e14b5f2d5cd/OptOut_April2023.csv
- CMS Opt-Out Affidavits, August 2026 CSV https://data.cms.gov/sites/default/files/2026-09/2ee35619-a4b9-497d-b3e0-6228d45c0509/OptOut_August2026.csv
- DPC Alliance, State of Direct Primary Care 2026 https://assets.noviams.com/novi-file-uploads/dpca/pdfs-and-documents/State_of_DPC_FINAL2026.pdf
- CMS Opt-Out Affidavits, December 2023 CSV https://data.cms.gov/sites/default/files/2024-01/4f86cfcc-3e3f-46fe-aaa4-7faa636a3762/OptOut_December2023.csv
- CMS Opt-Out Affidavits, December 2024 CSV https://data.cms.gov/sites/default/files/2025-01/159de946-877e-4ffe-8aca-e800b30bcda3/Opt_Out_List_December.csv
- CMS Opt-Out Affidavits, December 2025 CSV https://data.cms.gov/sites/default/files/2026-01/e549bc34-2f18-4704-ae86-d7838956721d/Opt_Out_List_December_2025.csv
- Becker's ASC, % of physicians in cash-only practice (Medscape) https://beckersasc.com/benchmarking/what-percent-of-physicians-are-in-a-cash-only-practice-9-stats.html
- Physicians Foundation 2018 Survey https://physiciansfoundation.org/wp-content/uploads/2018/09/physicians-survey-results-final-2018.pdf
- KFF press release, physician acceptance of new patients https://www.kff.org/medicare/press-release/analysis-the-vast-majority-of-physicians-accept-new-patients-including-patients-with-medicare-and-private-insurance/
- AMA Physician Practice Benchmark 2024 https://www.ama-assn.org/practice-management/private-practices/smaller-share-doctors-private-practice-ever
- NextMD, 2026 concierge doctor census (vendor) https://nextmd.ai/blog/how-many-concierge-doctors-are-there-in-the-us-the-2026-census
- NAMCS/NHAMCS 2010 factsheets https://espanol.cdc.gov/nchs/data/ahcd/NAMCS_NHAMCS_factsheets_2010_complete_set.pdf
- NAMCS 2015–16 physician office visits factsheet https://www.cdc.gov/nchs/data/namcs/factsheets/NAMCS-2015-16-physician-office-visits-508.pdf
- NCHS NHSR No. 184, office-based visits 2019 https://stacks.cdc.gov/view/cdc/125462/cdc_125462_DS1.pdf
- Medical Economics on Epic Research, self-pay encounters (Sept 2026) https://www.medicaleconomics.com/view/report-self-pay-patient-encounters-rose-and-medicaid-fell-across-all-care-settings
- KFF Medicaid Enrollment and Unwinding Tracker https://kff.org/medicaid/issue-brief/medicaid-enrollment-and-unwinding-tracker/
- MEPS Statistical Brief #517 (2016) https://meps.ahrq.gov/data_files/publications/st517/stat517.shtml
- Brahmbhatt & Schpero, JAMA 2024 secret shopper https://jamanetwork.com/journals/jama/fullarticle/2821639
- APA press release, insurance challenges (Dec 2024) https://www.apa.org/news/press/releases/2024/12/insurance-challenges-limit-psychologists
- NBCE Practice Analysis 2005, ch. 7 https://www.nbce.org/wp-content/uploads/chapter_07_2005.pdf
- NBCE Practice Analysis 2020 (Dynamic Chiropractic) https://mailinglists.mpamedia.com/mpacms/dc/article.php?id=57561
- ASPS Cosmetic Procedure Trends 2018 https://www.plasticsurgery.org/documents/news/statistics/2018/cosmetic-procedure-trends-2018.pdf
- CDC press release, ART 2000 https://archive.cdc.gov/www_cdc_gov/media/pressrel/r021220.htm
- CDC ART surveillance at a glance (2022) https://www.cdc.gov/art/php/surveillance/index.html
- Harmon (Market Scope), CRST Aug 2011 https://crstoday.com/wp-content/themes/crst/assets/downloads/CRST0811_feature_harmon.pdf
- AmSpa 2024 Med Spa State of the Industry https://www.americanmedspa.org/blog/2024-medical-spa-state-of-the-industry-executive-report-recap
- AOPT Payment Survey Results Summary https://www.orthopt.org/uploads/content_files/files/AOPT_Payment_Survey_Results_Summary.pdf
- Psychiatrist Medicare opt-out study, 2017 data (PubMed 31420824) https://www.pubmed.ncbi.nlm.nih.gov/31420824/
- AAFP FPM, surveys show more FPs practicing DPC https://www.aafp.org/fpm/blogs/quick-tips/dpc-surveys
- OSU Wexner, dermatology access by payer https://wexnermedical.osu.edu/mediaroom/pressreleaselisting/study-shows-disparities-in-access-to-dermatologic-care
- MDedge, Medicaid acceptance 33% for dermatologists https://mdedge.com/content/medicaid-acceptance-33-dermatologists
- AAHKS Medicare Opt-Out White Paper (Jul 2026) https://www.aahks.org/wp-content/uploads/2026/07/AAHKS-Medicare-Opt-Out-White-Paper-07.26.pdf
- Dynamic Chiropractic (cash-practice claim) https://mailinglists.mpamedia.com/mpacms/dc/article.php?id=58617
- WebPT, cash-pay PT 2021 https://www.webpt.com/blog/why-cash-pay-physical-therapy-is-the-best-way-to-diversify-clinic-revenue-in-2021/
- ADA HPI, National Dental Expenditures https://www.ada.org/resources/research/health-policy-institute/dental-care-market/national-dental-expenses
- ADA HPI, dental benefits and Medicaid https://www.ada.org/en/science-research/health-policy-institute/dental-statistics/dental-benefits-and-medicaid
- Stateline, state IVF coverage efforts (May 2025) https://stateline.org/2025/05/14/what-trump-the-fertilization-president-can-learn-from-state-efforts-to-expand-ivf-access/
- IBISWorld, IV hydration centers https://www.ibisworld.com/united-states/industry/intravenous-iv-hydration-centers-in-the-us/6337/
- DPC Frontier mapper, Dec 2018 (Wayback) https://web.archive.org/web/20181205092651/https://www.dpcfrontier.com/mapper/
- DPC Frontier mapper, Dec 2020 (Wayback) https://web.archive.org/web/20201212041743/https://mapper.dpcfrontier.com/
- DPC Frontier mapper, Dec 2022 (Wayback) https://web.archive.org/web/20221202094011/https://mapper.dpcfrontier.com/
- DPC Frontier mapper, Dec 2023 (Wayback) https://web.archive.org/web/20231207132804/https://mapper.dpcfrontier.com/
- DPC Frontier mapper, Nov 2024 (Wayback) https://web.archive.org/web/20241102005207/https://mapper.dpcfrontier.com/
- Goldstein & Yerkes, Annals of Family Medicine 2024 https://pmc.ncbi.nlm.nih.gov/articles/PMC11588384/
- DPC Frontier mapper, Nov 2016 (Wayback) https://web.archive.org/web/20161122201138/http://www.dpcfrontier.com/mapper/
- DPC Frontier mapper, Dec 2017 (Wayback) https://web.archive.org/web/20171203133233/http://www.dpcfrontier.com/mapper
- DPC Frontier mapper, Mar 2018 (Wayback) https://web.archive.org/web/20180322074028/https://www.dpcfrontier.com/mapper/
- DPC Frontier mapper, Jun 2018 (Wayback) https://web.archive.org/web/20180617164255/https://www.dpcfrontier.com/mapper
- DPC Frontier mapper, Dec 2019 (Wayback) https://web.archive.org/web/20191213024223/https://mapper.dpcfrontier.com/
- DPC Frontier mapper, Feb 2021 (Wayback) https://web.archive.org/web/20210215121713/https://mapper.dpcfrontier.com/
- DPC Frontier mapper, Jul 2021 (Wayback) https://web.archive.org/web/20210707181820/https://mapper.dpcfrontier.com/
- DPC Frontier mapper, Nov 2021 (Wayback) https://web.archive.org/web/20211117170306/https://mapper.dpcfrontier.com/
- DPC Frontier mapper, Jun 2022 (Wayback) https://web.archive.org/web/20220602230822/https://mapper.dpcfrontier.com/
- Atlas MD blog, 2,700+ DPC practices (Dec 2025) https://blog.atlas.md/2025/12/there-are-now-over-2700-dpc-practices-as-the-market-heads-toward-90-billion/
- Hint Health, State of DPC 2026 takeaways https://blog.hint.com/state-of-dpc-2026-key-takeaways-from-the-dpc-alliances-physician-survey
- Milliman, What our study says about DPC (2020) https://www.milliman.com/en/insight/what-our-study-says-about-direct-primary-care
- MDVIP press room, membership growth https://www.mdvip.com/about-mdvip/press-room/membership-healthcare-growth
- PR Newswire, MDVIP passes 1,000 physicians (2019) https://www.prnewswire.com/news-releases/mdvip-reaches-major-milestone-of-over-1-000-primary-care-physicians-nationwide-300933462.html
- MDVIP press release, 100 consecutive quarters (Feb 2026) https://www.mdvip.com/about-mdvip/press-room/mdvip-celebrates-its-momentum-100-consecutive-quarters-growth-milestone-and-new-boca-raton-hq
- Summit Partners, MDVIP https://www.summitpartners.com/companies/mdvip
- Charlesbank, MDVIP https://www.charlesbank.com/investments/mdvip/
- GAO-05-929, Concierge Care (2005) https://www.gao.gov/assets/gao-05-929.pdf
- Hims & Hers FY2022 10-K https://www.sec.gov/Archives/edgar/data/1773751/000177375123000029/hims-20221231.htm
- Hims & Hers FY2023 10-K https://www.sec.gov/Archives/edgar/data/1773751/000177375124000025/hims-20231231.htm
- Hims & Hers FY2025 10-K https://www.sec.gov/Archives/edgar/data/1773751/000177375126000022/hims-20251231.htm
- IFM surpasses 1,000 certified practitioners (2019) https://www.prnewswire.com/news-releases/the-institute-for-functional-medicine-surpasses-1-000-ifm-certified-practitioners-in-functional-medicine-globally-300856311.html
- IFM, certified practitioner count (Feb 2022) https://www.businesswire.com/news/home/20220208006018/en/IFM-Announces-Slate-of-Board-Officers-and-Celebrates-Growing-Number-of-Practitioners-Trained-in-Functional-Medicine
- Crain's Cleveland, Cleveland Clinic functional medicine (2017) https://www.crainscleveland.com/article/20170122/news/170129962/cleveland-clinics-holistic-center-rapid-ascent/
- TIME, Why the doctor takes only cash (2017) https://time.com/4649914/why-the-doctor-takes-only-cash/
- Hims & Hers FY2025 results release https://investors.hims.com/news/news-details/2026/Hims--Hers-Health-Inc--Reports-Fourth-Quarter-and-Full-Year-2025-Financial-Results/
- Eli Lilly IR, Zepbound self-pay vials https://investor.lilly.com/news-releases/news-release-details/lilly-offer-all-approved-doses-zepbound-tirzepatide-single-dose
- Wikipedia, Medspa (secondary) https://www.wikipedia.org/wiki/Medspa
- MDedge/TIME, ketamine clinics (2023) https://www.mdedge.com/content/time-national-ketamine-registry-experts-say/page/0/1
- PDMP testosterone prescribing study (PMC11355536) https://www.ncbi.nlm.nih.gov/pmc/articles/PMC11355536/
- USC Schaeffer, copays exceed drug cost (JAMA 2018) https://schaeffer.usc.edu/research/study-finds-consumer-copays-frequently-exceed-cost-of-common-prescriptions/
- Hospital cash vs negotiated prices, 2,379 hospitals (PubMed 37011313) https://www.pubmed.ncbi.nlm.nih.gov/37011313/
- Trinity College, Economics Letters 2021 cash vs negotiated https://www.trincoll.edu/news/hospitals-often-charge-more-to-insured-than-uninsured-for-same-services/
- GoodRx FY2025 10-K https://www.sec.gov/Archives/edgar/data/1809519/000180951926000031/gdrx-20251231.htm
- KFF EHBS 2025 full report PDF https://files.kff.org/attachment/Employer-Health-Benefits-Survey-2025-Annual-Survey.pdf
- AAFP Innovation Lab / HintOS DPC report https://www.aafp.org/content/dam/AAFP/documents/practice_management/innovation_lab/report-hintos-dpc-management-phase-1.pdf
- NPR via VPM, paying your doctor cash (2016) https://www.vpm.org/npr-news/2016-01-13/would-paying-your-doctor-cash-up-front-get-you-better-care
- Morra et al., Health Affairs 2011 (Commonwealth Fund release) https://www.commonwealthfund.org/sites/default/files/documents/___media_files_news_news_releases_2011_aug_morra_casalino_release_final_8211.pdf
- ACC, CY2027 Physician Fee Schedule proposed rule https://www.acc.org/latest-in-cardiology/articles/2026/07/14/21/36/cms-releases-2027
- Radiology Business, AMA 29% decline 2001–2024 https://radiologybusiness.com/topics/healthcare-management/healthcare-policy/ama-warns-growing-gap-between-medicare-pay-and-cost-physician-care
- AMA, physician burnout rate 2024 https://www.ama-assn.org/practice-management/physician-health/physician-burnout-rate-drops-below-50-first-time-4-years
- AMA 2024 prior authorization survey https://ama-assn.org/practice-management/prior-authorization/exhausted-prior-auth-many-patients-abandon-care-ama-survey
- CGS Medicare opt-out affidavit https://www.cgsmedicare.com/partb/enrollment/part_b_optout_sample.pdf
- Fierce Healthcare, two DPC pioneers close (2017) https://www.fiercehealthcare.com/practices/future-direct-primary-care-question-as-two-pioneering-businesses-close
- JHU Carey, fee-based primary care rising https://carey.jhu.edu/articles/fee-based-primary-care-rapidly-rising-us-hastening-doctor-shortages-public
- Tseng et al., JAMA 2018, billing & insurance costs https://pmc.ncbi.nlm.nih.gov/articles/5839285
- Casalino et al., Health Affairs 2009 (Commonwealth Fund) https://commonwealthfund.org/newsletter/ealert/physician-practices-spend-31-billion-year-health-insurance-plan-interaction
- KFF, claims denials in ACA marketplace plans 2023 https://www.kff.org/private-insurance/claims-denials-and-appeals-in-aca-marketplace-plans-in-2023/
- Medscape 2024 burnout report (AuntMinnie) https://www.auntminnie.com/practice-management/administration/economics/article/15619445/report-burnout-is-prevalent-among-us-physicians
- Peterson et al., JABFM 2015, panel sizes https://www.jabfm.org/content/28/2/173.full.txt
- Elation Health, DPC physician motivations (secondary) https://www.elationhealth.com/resources/blogs/should-i-start-or-join-a-dpc-practice
- Devenir, HSA assets year-end 2025 https://www.devenir.com/hsa-assets-reach-nearly-174-billion-at-year-end-2025-as-investment-assets-rise-to-85-billion/
- AAFP FPM, In Defense of Direct Primary Care (2016) https://www.aafp.org/pubs/fpm/issues/2016/0900/p12.html
- DPC Coalition (dpcare.org) https://www.dpcare.org/
- KFF EHBS 2025, Figure 8.4 (HDHP/SO enrollment) https://www.kff.org/wp-content/uploads/sites/7/2025/10/Figure-8-4_49760f.png
- KFF EHBS 2025, Figure 7.14 (deductible ≥$2,000) https://www.kff.org/wp-content/uploads/sites/7/2025/10/Figure-7-14_22043e.png
- Commonwealth Fund underinsured exhibits (Oct 2017) https://www.commonwealthfund.org/sites/default/files/documents/___media_files_publications_issue_brief_2017_oct_pdf_collins_biennial_underinsured_exhibits.pdf
- Commonwealth Fund 2020 Biennial https://www.commonwealthfund.org/publications/issue-briefs/2020/aug/looming-crisis-health-coverage-2020-biennial
- Commonwealth Fund 2022 Biennial data brief https://www.commonwealthfund.org/sites/default/files/2022-09/Collins_state_of_coverage_biennial_survey_2022_db.pdf
- Commonwealth Fund 2024 Biennial Survey https://www.commonwealthfund.org/publications/surveys/2024/nov/state-health-insurance-coverage-us-2024-biennial-survey
- Managed Care, HCCI primary care visits 2012–2016 https://www.managedcaremag.com/?p=6922
- DC HBX actuarial review citing CBO (2018) https://hbx.dc.gov/sites/default/files/dc/sites/hbx/event_content/attachments/Review%20of%20Individual%20Mandate%20Repeal%20in%20DC%202.6.2018.pdf
- Georgetown CHIR research roundup https://chir.georgetown.edu/?p=4696
- NCHS Long-term Trends in Health Insurance Coverage 1968–2022 https://cdc.gov/nchs/data/nhis/health_insurance/TrendHealthInsurance1968_2022.pdf
- CDC NCHS press release, May 28 2026 https://cdc.gov/nchs/pressroom/releases/20260528.html
- Fierce Healthcare, Census uninsured 2025 https://www.fiercehealthcare.com/payers/census-bureau-uninsurance-rates-held-steady-2024-2025
- Healthcare Dive, health care sharing ministries https://www.healthcaredive.com/news/healthcare-sharing-ministries-5-things-to-know/521229/
- KFF, marketplace deductible grew ~$1,000 in 2026 https://www.kff.org/affordable-care-act/the-average-marketplace-deductible-grew-by-about-1000-per-person-in-2026-with-more-enrollees-shifting-to-higher-deductible-plans-as-enhanced-tax-credits-expired/
- KFF, What we know so far about 2026 marketplace https://www.kff.org/affordable-care-act/what-we-know-so-far-about-2026-aca-marketplace-enrollment-premiums-and-deductibles/
- KFF, allocating CBO coverage-loss estimates (OBBBA) https://www.kff.org/affordable-care-act/issue-brief/how-will-the-2025-reconciliation-bill-affect-the-uninsured-rate-in-each-state-allocating-cbos-estimates-of-coverage-loss/
- AJMC, Assessing utilization of a marketwide price transparency tool https://www.ajmc.com/view/assessing-utilization-of-a-marketwide-price-transparency-tool
- CMS No Surprises Act: rights for people who don't have or don't use insurance https://www.cms.gov/nosurprises/consumers/understand-your-rights-and-protections-against-surprise-medical-bills
- NCHS Advance Data No. 213 (NAMCS 1990) https://www.cdc.gov/nchs/data/ad/ad213.pdf
- CMS NHEA methodology paper 2024 (definitions, sources, methods) https://www.cms.gov/files/document/definitions-sources-methods.pdf
- Health, United States 2020–2021, Table HExpPers (CMS NHE) https://www.cdc.gov/nchs/data/hus/2020-2021/hexppers.pdf
- Census Service Annual Survey 2014, Table 4 (2010–2014) https://www2.census.gov/programs-surveys/sas/tables/time-series/sas-latest/sas-14.xls
- Census Nonemployer Statistics, national file (2023; series back to 2008) https://www2.census.gov/programs-surveys/nonemployer-statistics/datasets/2023/historical-datasets/nonemp23us.zip
- Tabflows DPC directory count 2026 https://www.tabflows.com/blog/how-many-direct-primary-care-practices-2026
- BLS OES May 2025 national estimates https://www.bls.gov/oes/special-requests/oesm25nat.zip
- Becker's ASC summarizing AAMC active physicians by specialty https://www.beckersasc.com/asc-news/number-of-active-physicians-by-specialty/